
 Yahoo Finance
 Those who invested in HORNBACH Holding KGaA (ETR:HBH) five years ago are up 81%
When we invest, we're generally looking for stocks that outperform the market average. And in our experience, buying the right stocks can give your wealth a significant boost. For example, the HORNBACH Holding AG & Co. KGaA (ETR:HBH) share price is up 58% in the last 5 years, clearly besting the market return of around 2.9% (ignoring dividends). However, more recent returns haven't been as impressive as that, with the stock returning just 9.6% in the last year , including dividends .
Let's take a look at the underlying fundamentals over the longer term, and see if they've been consistent with shareholders returns.
See our latest analysis for HORNBACH Holding KGaA
There is no denying that markets are sometimes efficient, but prices do not always reflect underlying business performance. One way to examine how market sentiment has changed over time is to look at the interaction between a company's share price and its earnings per share (EPS).
During five years of share price growth, HORNBACH Holding KGaA achieved compound earnings per share (EPS) growth of 7.4% per year. This EPS growth is slower than the share price growth of 10% per year, over the same period. So it's fair to assume the market has a higher opinion of the business than it did five years ago. And that's hardly shocking given the track record of growth.
You can see how EPS has changed over time in the image below (click on the chart to see the exact values).
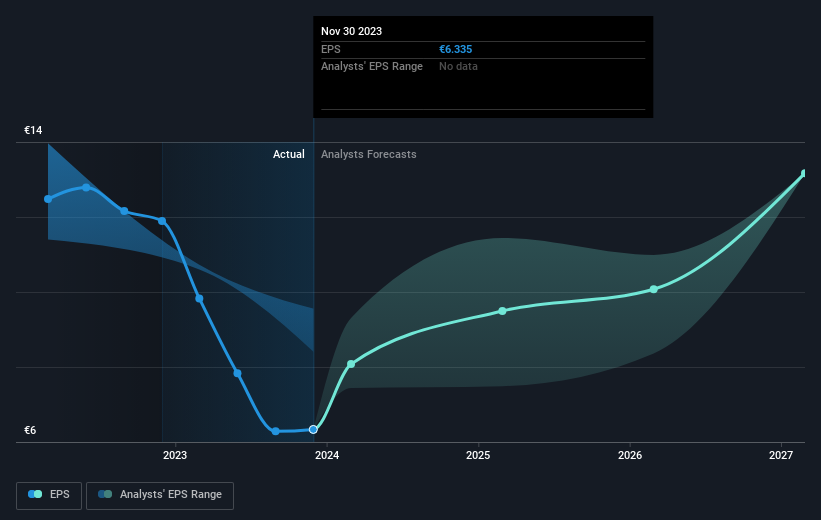
Dive deeper into HORNBACH Holding KGaA's key metrics by checking this interactive graph of HORNBACH Holding KGaA's earnings, revenue and cash flow.
What About Dividends?
It is important to consider the total shareholder return, as well as the share price return, for any given stock. The TSR is a return calculation that accounts for the value of cash dividends (assuming that any dividend received was reinvested) and the calculated value of any discounted capital raisings and spin-offs. Arguably, the TSR gives a more comprehensive picture of the return generated by a stock. As it happens, HORNBACH Holding KGaA's TSR for the last 5 years was 81%, which exceeds the share price return mentioned earlier. And there's no prize for guessing that the dividend payments largely explain the divergence!
A Different Perspective
It's nice to see that HORNBACH Holding KGaA shareholders have received a total shareholder return of 9.6% over the last year. Of course, that includes the dividend. However, that falls short of the 13% TSR per annum it has made for shareholders, each year, over five years. While it is well worth considering the different impacts that market conditions can have on the share price, there are other factors that are even more important. Case in point: We've spotted 2 warning signs for HORNBACH Holding KGaA you should be aware of.
Of course HORNBACH Holding KGaA may not be the best stock to buy. So you may wish to see this free collection of growth stocks.
Please note, the market returns quoted in this article reflect the market weighted average returns of stocks that currently trade on German exchanges.
Have feedback on this article? Concerned about the content? Get in touch with us directly. Alternatively, email editorial-team (at) simplywallst.com.
This article by Simply Wall St is general in nature. We provide commentary based on historical data and analyst forecasts only using an unbiased methodology and our articles are not intended to be financial advice. It does not constitute a recommendation to buy or sell any stock, and does not take account of your objectives, or your financial situation. We aim to bring you long-term focused analysis driven by fundamental data. Note that our analysis may not factor in the latest price-sensitive company announcements or qualitative material. Simply Wall St has no position in any stocks mentioned.
