
 Yahoo Finance
 Those who invested in Fulton Financial (NASDAQ:FULT) a year ago are up 33%
One way to deal with stock volatility is to ensure you have a properly diverse portfolio. Of course, the aim of the game is to pick stocks that do better than an index fund. Fulton Financial Corporation (NASDAQ:FULT) has done well over the last year, with the stock price up 26% beating the market return of 22% (not including dividends). Zooming out, the stock is actually down 1.1% in the last three years.
With that in mind, it's worth seeing if the company's underlying fundamentals have been the driver of long term performance, or if there are some discrepancies.
See our latest analysis for Fulton Financial
While the efficient markets hypothesis continues to be taught by some, it has been proven that markets are over-reactive dynamic systems, and investors are not always rational. One way to examine how market sentiment has changed over time is to look at the interaction between a company's share price and its earnings per share (EPS).
During the last year, Fulton Financial actually saw its earnings per share drop 3.9%.
The mild decline in EPS may be a result of the fact that the company is more focused on other aspects of the business, right now. Since the change in EPS doesn't seem to correlate with the change in share price, it's worth taking a look at other metrics.
For starters, we suspect the share price has been buoyed by the dividend, which was increased during the year. It could be that the company is reaching maturity and dividend investors are buying for the yield, pushing the price up in the process. Though we must add that the revenue growth of 3.5% year on year would have helped paint a pretty picture.
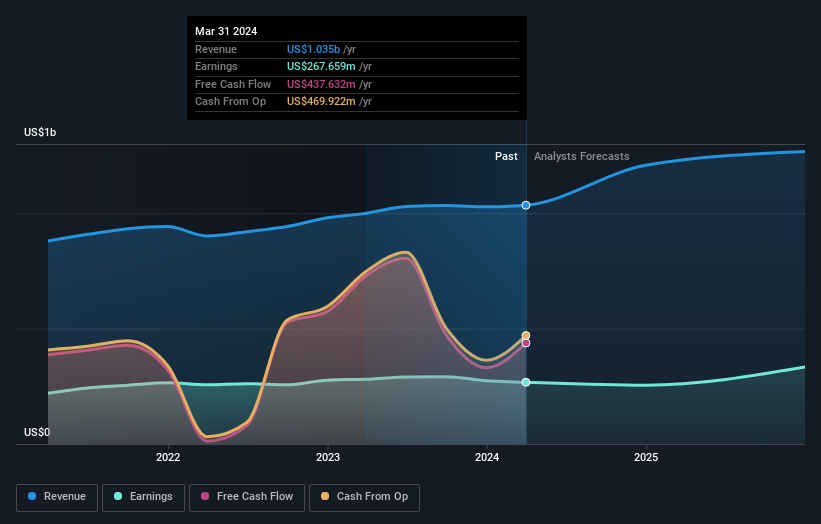
You can see below how earnings and revenue have changed over time (discover the exact values by clicking on the image).
It's probably worth noting that the CEO is paid less than the median at similar sized companies. But while CEO remuneration is always worth checking, the really important question is whether the company can grow earnings going forward. This free report showing analyst forecasts should help you form a view on Fulton Financial
What About Dividends?
It is important to consider the total shareholder return, as well as the share price return, for any given stock. The TSR is a return calculation that accounts for the value of cash dividends (assuming that any dividend received was reinvested) and the calculated value of any discounted capital raisings and spin-offs. So for companies that pay a generous dividend, the TSR is often a lot higher than the share price return. We note that for Fulton Financial the TSR over the last 1 year was 33%, which is better than the share price return mentioned above. This is largely a result of its dividend payments!
A Different Perspective
It's nice to see that Fulton Financial shareholders have received a total shareholder return of 33% over the last year. That's including the dividend. Since the one-year TSR is better than the five-year TSR (the latter coming in at 5% per year), it would seem that the stock's performance has improved in recent times. In the best case scenario, this may hint at some real business momentum, implying that now could be a great time to delve deeper. It's always interesting to track share price performance over the longer term. But to understand Fulton Financial better, we need to consider many other factors. To that end, you should be aware of the 1 warning sign we've spotted with Fulton Financial .
Of course Fulton Financial may not be the best stock to buy. So you may wish to see this free collection of growth stocks.
Please note, the market returns quoted in this article reflect the market weighted average returns of stocks that currently trade on American exchanges.
Have feedback on this article? Concerned about the content? Get in touch with us directly. Alternatively, email editorial-team (at) simplywallst.com.
This article by Simply Wall St is general in nature. We provide commentary based on historical data and analyst forecasts only using an unbiased methodology and our articles are not intended to be financial advice. It does not constitute a recommendation to buy or sell any stock, and does not take account of your objectives, or your financial situation. We aim to bring you long-term focused analysis driven by fundamental data. Note that our analysis may not factor in the latest price-sensitive company announcements or qualitative material. Simply Wall St has no position in any stocks mentioned.