
 Yahoo Finance
 Those who invested in Employers Holdings (NYSE:EIG) a year ago are up 28%
These days it's easy to simply buy an index fund, and your returns should (roughly) match the market. But investors can boost returns by picking market-beating companies to own shares in. To wit, the Employers Holdings, Inc. (NYSE:EIG) share price is 25% higher than it was a year ago, much better than the market return of around 17% (not including dividends) in the same period. So that should have shareholders smiling. However, the longer term returns haven't been so impressive, with the stock up just 1.1% in the last three years.
So let's investigate and see if the longer term performance of the company has been in line with the underlying business' progress.
Check out our latest analysis for Employers Holdings
There is no denying that markets are sometimes efficient, but prices do not always reflect underlying business performance. By comparing earnings per share (EPS) and share price changes over time, we can get a feel for how investor attitudes to a company have morphed over time.
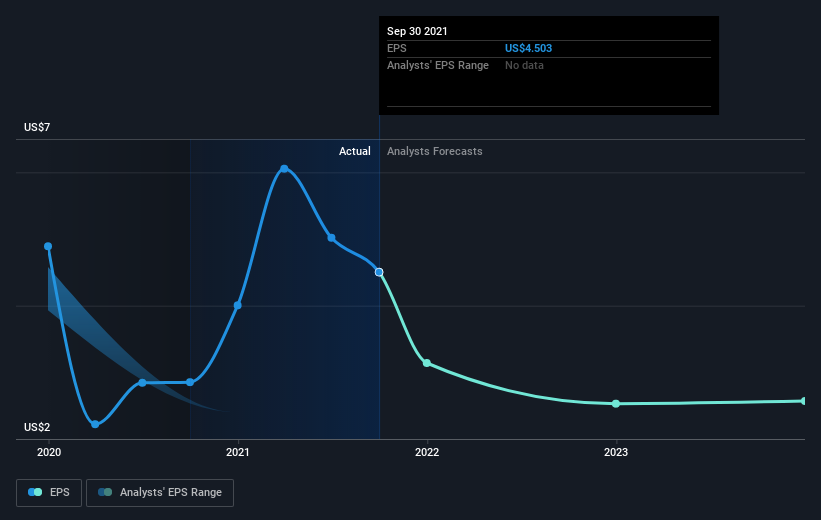
Employers Holdings was able to grow EPS by 58% in the last twelve months. It's fair to say that the share price gain of 25% did not keep pace with the EPS growth. Therefore, it seems the market isn't as excited about Employers Holdings as it was before. This could be an opportunity. The caution is also evident in the lowish P/E ratio of 8.94.
You can see how EPS has changed over time in the image below (click on the chart to see the exact values).
It's probably worth noting we've seen significant insider buying in the last quarter, which we consider a positive. On the other hand, we think the revenue and earnings trends are much more meaningful measures of the business. Dive deeper into the earnings by checking this interactive graph of Employers Holdings' earnings, revenue and cash flow.
What About Dividends?
It is important to consider the total shareholder return, as well as the share price return, for any given stock. The TSR incorporates the value of any spin-offs or discounted capital raisings, along with any dividends, based on the assumption that the dividends are reinvested. So for companies that pay a generous dividend, the TSR is often a lot higher than the share price return. As it happens, Employers Holdings' TSR for the last 1 year was 28%, which exceeds the share price return mentioned earlier. This is largely a result of its dividend payments!
A Different Perspective
It's nice to see that Employers Holdings shareholders have received a total shareholder return of 28% over the last year. That's including the dividend. That gain is better than the annual TSR over five years, which is 3%. Therefore it seems like sentiment around the company has been positive lately. Given the share price momentum remains strong, it might be worth taking a closer look at the stock, lest you miss an opportunity. I find it very interesting to look at share price over the long term as a proxy for business performance. But to truly gain insight, we need to consider other information, too. For example, we've discovered 1 warning sign for Employers Holdings that you should be aware of before investing here.
If you like to buy stocks alongside management, then you might just love this free list of companies. (Hint: insiders have been buying them).
Please note, the market returns quoted in this article reflect the market weighted average returns of stocks that currently trade on US exchanges.
Have feedback on this article? Concerned about the content? Get in touch with us directly. Alternatively, email editorial-team (at) simplywallst.com.
This article by Simply Wall St is general in nature. We provide commentary based on historical data and analyst forecasts only using an unbiased methodology and our articles are not intended to be financial advice. It does not constitute a recommendation to buy or sell any stock, and does not take account of your objectives, or your financial situation. We aim to bring you long-term focused analysis driven by fundamental data. Note that our analysis may not factor in the latest price-sensitive company announcements or qualitative material. Simply Wall St has no position in any stocks mentioned.
