
 Yahoo Finance
 Those who invested in Cue Energy Resources (ASX:CUE) a year ago are up 115%
Passive investing in index funds can generate returns that roughly match the overall market. But one can do better than that by picking better than average stocks (as part of a diversified portfolio). To wit, the Cue Energy Resources Limited (ASX:CUE) share price is 77% higher than it was a year ago, much better than the market return of around 6.0% (not including dividends) in the same period. That's a solid performance by our standards! Also impressive, the stock is up 64% over three years, making long term shareholders happy, too.
Let's take a look at the underlying fundamentals over the longer term, and see if they've been consistent with shareholders returns.
See our latest analysis for Cue Energy Resources
There is no denying that markets are sometimes efficient, but prices do not always reflect underlying business performance. One flawed but reasonable way to assess how sentiment around a company has changed is to compare the earnings per share (EPS) with the share price.
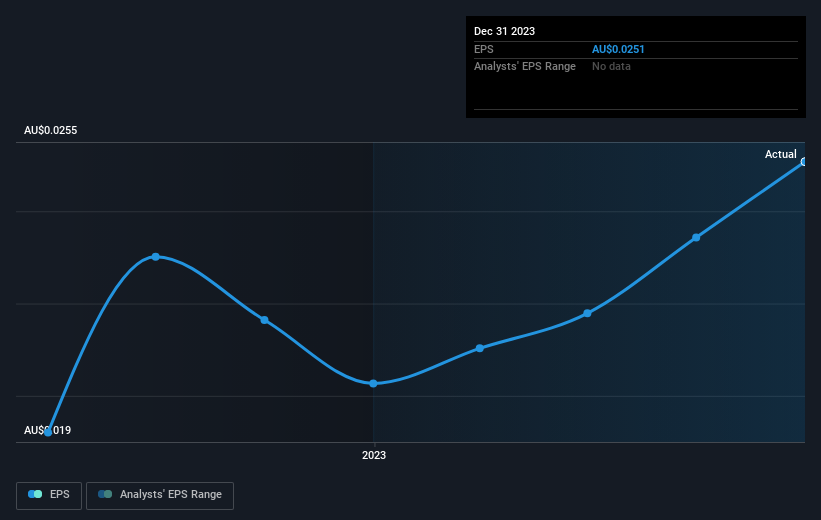
During the last year Cue Energy Resources grew its earnings per share (EPS) by 24%. This EPS growth is significantly lower than the 77% increase in the share price. This indicates that the market is now more optimistic about the stock.
The company's earnings per share (over time) is depicted in the image below (click to see the exact numbers).
This free interactive report on Cue Energy Resources' earnings, revenue and cash flow is a great place to start, if you want to investigate the stock further.
What About The Total Shareholder Return (TSR)?
Investors should note that there's a difference between Cue Energy Resources' total shareholder return (TSR) and its share price change, which we've covered above. The TSR is a return calculation that accounts for the value of cash dividends (assuming that any dividend received was reinvested) and the calculated value of any discounted capital raisings and spin-offs. Cue Energy Resources hasn't been paying dividends, but its TSR of 115% exceeds its share price return of 77%, implying it has either spun-off a business, or raised capital at a discount; thereby providing additional value to shareholders.
A Different Perspective
It's good to see that Cue Energy Resources has rewarded shareholders with a total shareholder return of 115% in the last twelve months. That gain is better than the annual TSR over five years, which is 15%. Therefore it seems like sentiment around the company has been positive lately. Someone with an optimistic perspective could view the recent improvement in TSR as indicating that the business itself is getting better with time. While it is well worth considering the different impacts that market conditions can have on the share price, there are other factors that are even more important. For example, we've discovered 2 warning signs for Cue Energy Resources (1 doesn't sit too well with us!) that you should be aware of before investing here.
Of course, you might find a fantastic investment by looking elsewhere. So take a peek at this free list of companies we expect will grow earnings.
Please note, the market returns quoted in this article reflect the market weighted average returns of stocks that currently trade on Australian exchanges.
Have feedback on this article? Concerned about the content? Get in touch with us directly. Alternatively, email editorial-team (at) simplywallst.com.
This article by Simply Wall St is general in nature. We provide commentary based on historical data and analyst forecasts only using an unbiased methodology and our articles are not intended to be financial advice. It does not constitute a recommendation to buy or sell any stock, and does not take account of your objectives, or your financial situation. We aim to bring you long-term focused analysis driven by fundamental data. Note that our analysis may not factor in the latest price-sensitive company announcements or qualitative material. Simply Wall St has no position in any stocks mentioned.
