
 Yahoo Finance
 Those who invested in Bloomin' Brands (NASDAQ:BLMN) a year ago are up 24%
If you want to compound wealth in the stock market, you can do so by buying an index fund. But if you pick the right individual stocks, you could make more than that. For example, the Bloomin' Brands, Inc. (NASDAQ:BLMN) share price is up 21% in the last 1 year, clearly besting the market decline of around 9.2% (not including dividends). So that should have shareholders smiling. Having said that, the longer term returns aren't so impressive, with stock gaining just 14% in three years.
Now it's worth having a look at the company's fundamentals too, because that will help us determine if the long term shareholder return has matched the performance of the underlying business.
Check out our latest analysis for Bloomin' Brands
While markets are a powerful pricing mechanism, share prices reflect investor sentiment, not just underlying business performance. By comparing earnings per share (EPS) and share price changes over time, we can get a feel for how investor attitudes to a company have morphed over time.
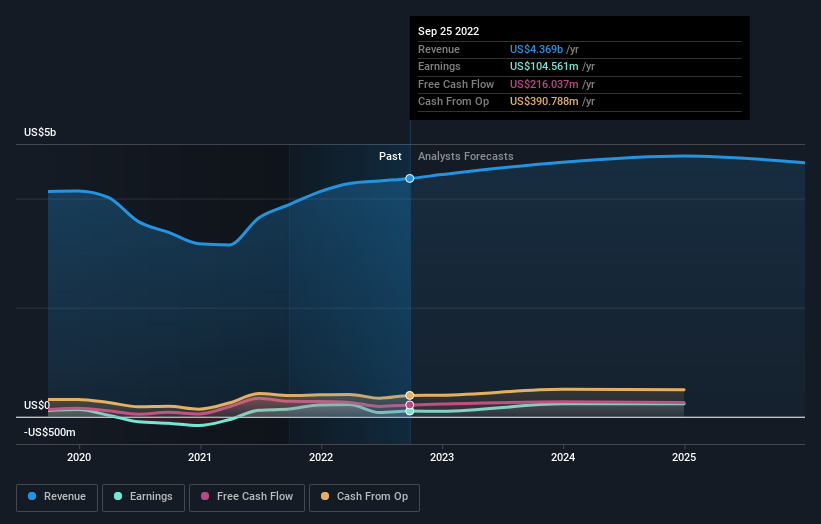
During the last year, Bloomin' Brands actually saw its earnings per share drop 26%.
So we don't think that investors are paying too much attention to EPS. Indeed, when EPS is declining but the share price is up, it often means the market is considering other factors.
However the year on year revenue growth of 12% would help. We do see some companies suppress earnings in order to accelerate revenue growth.
You can see below how earnings and revenue have changed over time (discover the exact values by clicking on the image).
Bloomin' Brands is a well known stock, with plenty of analyst coverage, suggesting some visibility into future growth. You can see what analysts are predicting for Bloomin' Brands in this interactive graph of future profit estimates.
What About Dividends?
When looking at investment returns, it is important to consider the difference between total shareholder return (TSR) and share price return. The TSR incorporates the value of any spin-offs or discounted capital raisings, along with any dividends, based on the assumption that the dividends are reinvested. It's fair to say that the TSR gives a more complete picture for stocks that pay a dividend. We note that for Bloomin' Brands the TSR over the last 1 year was 24%, which is better than the share price return mentioned above. And there's no prize for guessing that the dividend payments largely explain the divergence!
A Different Perspective
It's good to see that Bloomin' Brands has rewarded shareholders with a total shareholder return of 24% in the last twelve months. Of course, that includes the dividend. Since the one-year TSR is better than the five-year TSR (the latter coming in at 3% per year), it would seem that the stock's performance has improved in recent times. In the best case scenario, this may hint at some real business momentum, implying that now could be a great time to delve deeper. I find it very interesting to look at share price over the long term as a proxy for business performance. But to truly gain insight, we need to consider other information, too. Case in point: We've spotted 5 warning signs for Bloomin' Brands you should be aware of.
Of course Bloomin' Brands may not be the best stock to buy. So you may wish to see this free collection of growth stocks.
Please note, the market returns quoted in this article reflect the market weighted average returns of stocks that currently trade on US exchanges.
Have feedback on this article? Concerned about the content? Get in touch with us directly. Alternatively, email editorial-team (at) simplywallst.com.
This article by Simply Wall St is general in nature. We provide commentary based on historical data and analyst forecasts only using an unbiased methodology and our articles are not intended to be financial advice. It does not constitute a recommendation to buy or sell any stock, and does not take account of your objectives, or your financial situation. We aim to bring you long-term focused analysis driven by fundamental data. Note that our analysis may not factor in the latest price-sensitive company announcements or qualitative material. Simply Wall St has no position in any stocks mentioned.
Join A Paid User Research Session
You’ll receive a US$30 Amazon Gift card for 1 hour of your time while helping us build better investing tools for the individual investors like yourself. Sign up here
