
 Yahoo Finance
 Those who invested in AJ Lucas Group (ASX:AJL) a year ago are up 186%
Unfortunately, investing is risky - companies can and do go bankrupt. On the other hand, if you find a high quality business to buy (at the right price) you can more than double your money! For example, the AJ Lucas Group Limited (ASX:AJL) share price had more than doubled in just one year - up 186%. It's also good to see the share price up 135% over the last quarter. Zooming out, the stock is actually down 30% in the last three years.
So let's investigate and see if the longer term performance of the company has been in line with the underlying business' progress.
See our latest analysis for AJ Lucas Group
Given that AJ Lucas Group didn't make a profit in the last twelve months, we'll focus on revenue growth to form a quick view of its business development. When a company doesn't make profits, we'd generally expect to see good revenue growth. That's because fast revenue growth can be easily extrapolated to forecast profits, often of considerable size.
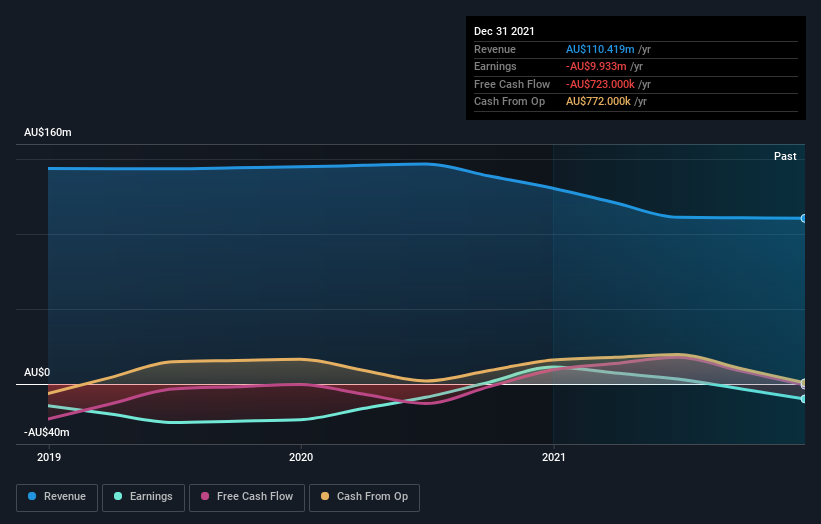
In the last year AJ Lucas Group saw its revenue shrink by 15%. So we would not have expected the share price to rise 186%. It just goes to show the market doesn't always pay attention to the reported numbers. It's quite likely the revenue fall was already priced in, anyway.
The graphic below depicts how earnings and revenue have changed over time (unveil the exact values by clicking on the image).
This free interactive report on AJ Lucas Group's balance sheet strength is a great place to start, if you want to investigate the stock further.
A Different Perspective
We're pleased to report that AJ Lucas Group shareholders have received a total shareholder return of 186% over one year. That certainly beats the loss of about 11% per year over the last half decade. The long term loss makes us cautious, but the short term TSR gain certainly hints at a brighter future. I find it very interesting to look at share price over the long term as a proxy for business performance. But to truly gain insight, we need to consider other information, too. For instance, we've identified 3 warning signs for AJ Lucas Group (1 can't be ignored) that you should be aware of.
If you would prefer to check out another company -- one with potentially superior financials -- then do not miss this free list of companies that have proven they can grow earnings.
Please note, the market returns quoted in this article reflect the market weighted average returns of stocks that currently trade on AU exchanges.
Have feedback on this article? Concerned about the content? Get in touch with us directly. Alternatively, email editorial-team (at) simplywallst.com.
This article by Simply Wall St is general in nature. We provide commentary based on historical data and analyst forecasts only using an unbiased methodology and our articles are not intended to be financial advice. It does not constitute a recommendation to buy or sell any stock, and does not take account of your objectives, or your financial situation. We aim to bring you long-term focused analysis driven by fundamental data. Note that our analysis may not factor in the latest price-sensitive company announcements or qualitative material. Simply Wall St has no position in any stocks mentioned.
