
 Yahoo Finance
 Those who invested in 2G Energy (ETR:2GB) five years ago are up 210%
The worst result, after buying shares in a company (assuming no leverage), would be if you lose all the money you put in. But on the bright side, you can make far more than 100% on a really good stock. Long term 2G Energy AG (ETR:2GB) shareholders would be well aware of this, since the stock is up 201% in five years. In more good news, the share price has risen 22% in thirty days. We note that 2G Energy reported its financial results recently; luckily, you can catch up on the latest revenue and profit numbers in our company report.
So let's assess the underlying fundamentals over the last 5 years and see if they've moved in lock-step with shareholder returns.
View our latest analysis for 2G Energy
There is no denying that markets are sometimes efficient, but prices do not always reflect underlying business performance. One way to examine how market sentiment has changed over time is to look at the interaction between a company's share price and its earnings per share (EPS).
During five years of share price growth, 2G Energy achieved compound earnings per share (EPS) growth of 18% per year. This EPS growth is slower than the share price growth of 25% per year, over the same period. This suggests that market participants hold the company in higher regard, these days. That's not necessarily surprising considering the five-year track record of earnings growth.
You can see below how EPS has changed over time (discover the exact values by clicking on the image).
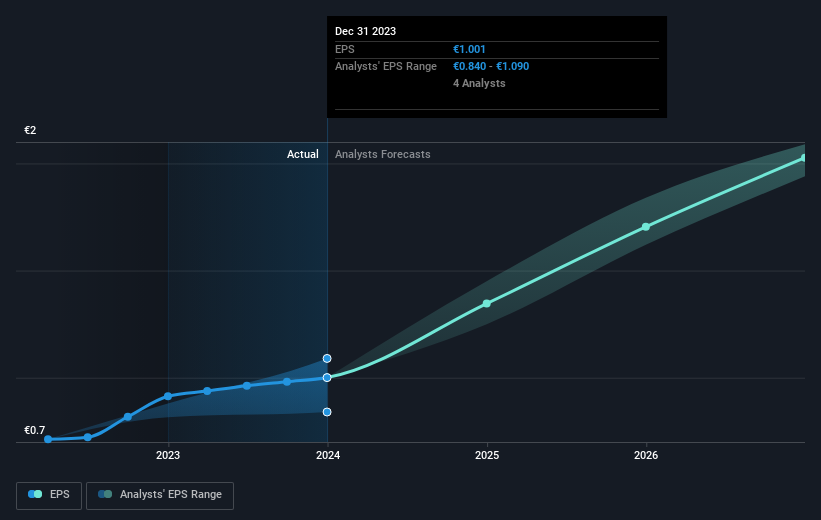
It might be well worthwhile taking a look at our free report on 2G Energy's earnings, revenue and cash flow.
What About Dividends?
When looking at investment returns, it is important to consider the difference between total shareholder return (TSR) and share price return. The TSR is a return calculation that accounts for the value of cash dividends (assuming that any dividend received was reinvested) and the calculated value of any discounted capital raisings and spin-offs. It's fair to say that the TSR gives a more complete picture for stocks that pay a dividend. We note that for 2G Energy the TSR over the last 5 years was 210%, which is better than the share price return mentioned above. This is largely a result of its dividend payments!
A Different Perspective
2G Energy's TSR for the year was broadly in line with the market average, at 8.9%. It has to be noted that the recent return falls short of the 25% shareholders have gained each year, over half a decade. Although the share price growth has slowed, the longer term story points to a business well worth watching. Before deciding if you like the current share price, check how 2G Energy scores on these 3 valuation metrics.
If you like to buy stocks alongside management, then you might just love this free list of companies. (Hint: insiders have been buying them).
Please note, the market returns quoted in this article reflect the market weighted average returns of stocks that currently trade on German exchanges.
Have feedback on this article? Concerned about the content? Get in touch with us directly. Alternatively, email editorial-team (at) simplywallst.com.
This article by Simply Wall St is general in nature. We provide commentary based on historical data and analyst forecasts only using an unbiased methodology and our articles are not intended to be financial advice. It does not constitute a recommendation to buy or sell any stock, and does not take account of your objectives, or your financial situation. We aim to bring you long-term focused analysis driven by fundamental data. Note that our analysis may not factor in the latest price-sensitive company announcements or qualitative material. Simply Wall St has no position in any stocks mentioned.
