
 Yahoo Finance
 Thor Industries Inc's Dividend Analysis
An In-Depth Look at Thor Industries Inc's Upcoming Dividend and Historical Performance
Thor Industries Inc(NYSE:THO) recently announced a dividend of $0.48 per share, payable on 2024-04-23, with the ex-dividend date set for 2024-04-08. As investors look forward to this upcoming payment, the spotlight also shines on the company's dividend history, yield, and growth rates. Using the data from GuruFocus, let's look into Thor Industries Inc's dividend performance and assess its sustainability.
What Does Thor Industries Inc Do?
This Powerful Chart Made Peter Lynch 29% A Year For 13 Years
How to calculate the intrinsic value of a stock?
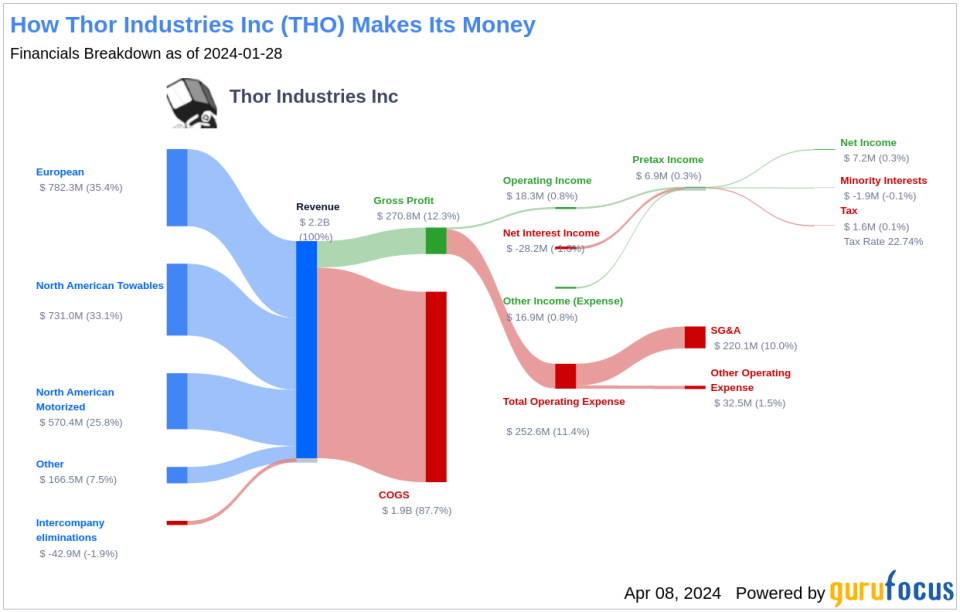
Based in Elkhart, Indiana, Thor Industries manufactures Class A, Class B, and Class C motor homes along with travel trailers and fifth wheel towables across over 30 brands. Through the acquisition of Erwin Hymer in 2019, the company expanded its geographic footprint and now produces various motorized and towable recreational vehicles for Europe, including motorcaravans, campervans, urban vehicles, caravans, and other RV-related products and services. The company has also begun generating revenue through aftermarket component parts through the acquisition of Airxcel in 2021, however, this is still a nascent part of the business as it accounts for less than 10% of total sales. In fiscal 2023, the company wholesaled 187,015 units and generated over $11.1 billion in revenue.
A Glimpse at Thor Industries Inc's Dividend History
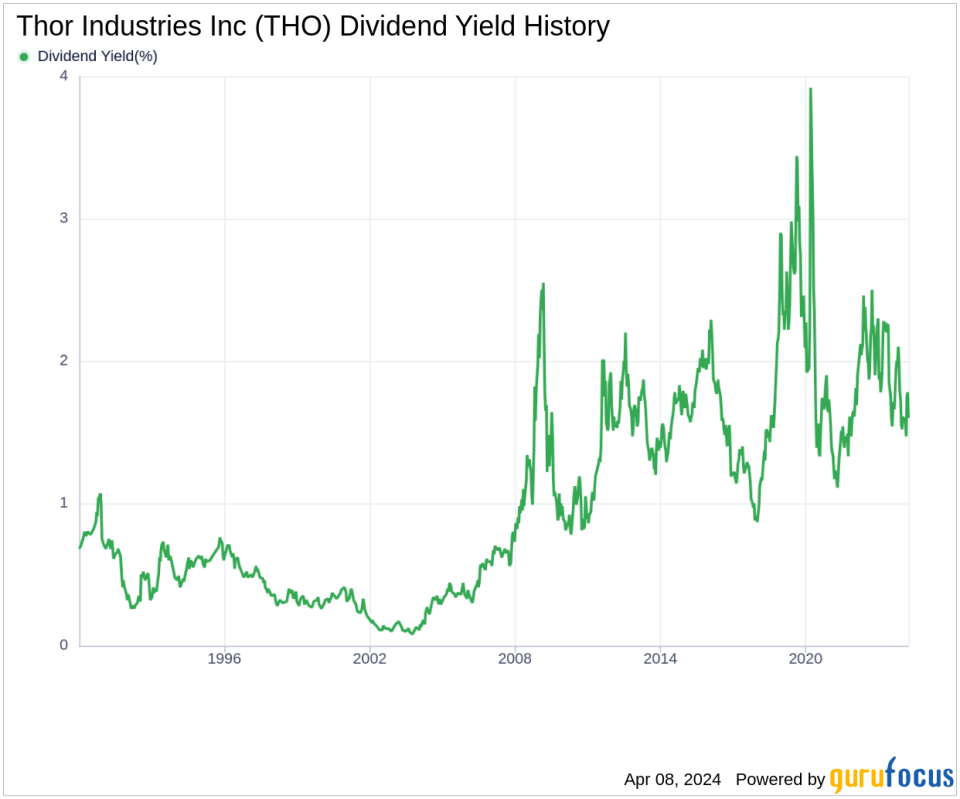
Thor Industries Inc has maintained a consistent dividend payment record since 1987. Dividends are currently distributed on a quarterly basis. Thor Industries Inc has increased its dividend each year since 1988. The stock is thus listed as a dividend aristocrat, an honor that is given to companies that have increased their dividend each year for at least the past 36 years. Below is a chart showing annual Dividends Per Share for tracking historical trends.
Breaking Down Thor Industries Inc's Dividend Yield and Growth
As of today, Thor Industries Inc currently has a 12-month trailing dividend yield of 1.65% and a 12-month forward dividend yield of 1.71%. This suggests an expectation of an increase in dividend payments over the next 12 months. Over the past three years, Thor Industries Inc's annual dividend growth rate was 4.00%. Extended to a five-year horizon, this rate decreased to 3.80% per year. And over the past decade, Thor Industries Inc's annual dividends per share growth rate stands at 8.60%.
Based on Thor Industries Inc's dividend yield and five-year growth rate, the 5-year yield on cost of Thor Industries Inc stock as of today is approximately 1.99%.
The Sustainability Question: Payout Ratio and Profitability
To assess the sustainability of the dividend, one needs to evaluate the company's payout ratio. The dividend payout ratio provides insights into the portion of earnings the company distributes as dividends. A lower ratio suggests that the company retains a significant part of its earnings, thereby ensuring the availability of funds for future growth and unexpected downturns. As of 2024-01-31, Thor Industries Inc's dividend payout ratio is 0.37.
Thor Industries Inc's profitability rank, offers an understanding of the company's earnings prowess relative to its peers. GuruFocus ranks Thor Industries Inc's profitability 9 out of 10 as of 2024-01-31, suggesting good profitability prospects. The company has reported positive net income for each of the years over the past decade, further solidifying its high profitability.
Growth Metrics: The Future Outlook
To ensure the sustainability of dividends, a company must have robust growth metrics. Thor Industries Inc's growth rank of 9 out of 10 suggests that the company's growth trajectory is good relative to its competitors.
Revenue is the lifeblood of any company, and Thor Industries Inc's revenue per share, combined with the 3-year revenue growth rate, indicates a strong revenue model. Thor Industries Inc's revenue has increased by approximately 11.90% per year on average, a rate that outperforms approximately 60.77% of global competitors.
The company's 3-year EPS growth rate showcases its capability to grow its earnings, a critical component for sustaining dividends in the long run. During the past three years, Thor Industries Inc's earnings increased by approximately 18.60% per year on average, a rate that outperforms approximately 56.09% of global competitors.
Lastly, the company's 5-year EBITDA growth rate of 15.90%, which outperforms approximately 71.78% of global competitors.
Next Steps
In conclusion, Thor Industries Inc's upcoming dividend payment is a continuation of its strong dividend history. The company's consistent dividend growth rate, reasonable payout ratio, and high profitability and growth metrics all point to the sustainability of its dividends. For investors seeking income, Thor Industries Inc presents a compelling case with its robust financial health and commitment to returning value to shareholders. As the company navigates through the dynamic RV market, it is well-positioned to maintain its dividend aristocrat status, and potentially deliver further growth. Will Thor Industries Inc continue to drive shareholder value with its dividend strategy? Only time will tell, but the indicators are promising.
GuruFocus Premium users can screen for high-dividend yield stocks using the High Dividend Yield Screener.
This article, generated by GuruFocus, is designed to provide general insights and is not tailored financial advice. Our commentary is rooted in historical data and analyst projections, utilizing an impartial methodology, and is not intended to serve as specific investment guidance. It does not formulate a recommendation to purchase or divest any stock and does not consider individual investment objectives or financial circumstances. Our objective is to deliver long-term, fundamental data-driven analysis. Be aware that our analysis might not incorporate the most recent, price-sensitive company announcements or qualitative information. GuruFocus holds no position in the stocks mentioned herein.
This article first appeared on GuruFocus.
