
 Yahoo Finance
 We Think Warrego Energy (ASX:WGO) Needs To Drive Business Growth Carefully
There's no doubt that money can be made by owning shares of unprofitable businesses. For example, although software-as-a-service business Salesforce.com lost money for years while it grew recurring revenue, if you held shares since 2005, you'd have done very well indeed. Nonetheless, only a fool would ignore the risk that a loss making company burns through its cash too quickly.
So, the natural question for Warrego Energy (ASX:WGO) shareholders is whether they should be concerned by its rate of cash burn. For the purpose of this article, we'll define cash burn as the amount of cash the company is spending each year to fund its growth (also called its negative free cash flow). The first step is to compare its cash burn with its cash reserves, to give us its 'cash runway'.
See our latest analysis for Warrego Energy
Does Warrego Energy Have A Long Cash Runway?
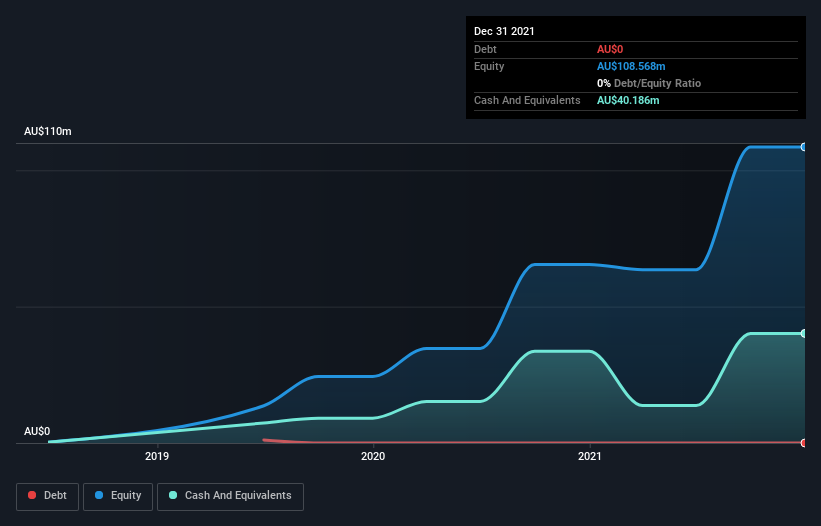
A company's cash runway is calculated by dividing its cash hoard by its cash burn. As at December 2021, Warrego Energy had cash of AU$40m and no debt. Looking at the last year, the company burnt through AU$35m. That means it had a cash runway of around 14 months as of December 2021. While that cash runway isn't too concerning, sensible holders would be peering into the distance, and considering what happens if the company runs out of cash. Depicted below, you can see how its cash holdings have changed over time.
How Is Warrego Energy's Cash Burn Changing Over Time?
In our view, Warrego Energy doesn't yet produce significant amounts of operating revenue, since it reported just AU$2.5m in the last twelve months. As a result, we think it's a bit early to focus on the revenue growth, so we'll limit ourselves to looking at how the cash burn is changing over time. During the last twelve months, its cash burn actually ramped up 76%. Oftentimes, increased cash burn simply means a company is accelerating its business development, but one should always be mindful that this causes the cash runway to shrink. Clearly, however, the crucial factor is whether the company will grow its business going forward. For that reason, it makes a lot of sense to take a look at our analyst forecasts for the company.
How Easily Can Warrego Energy Raise Cash?
Given its cash burn trajectory, Warrego Energy shareholders may wish to consider how easily it could raise more cash, despite its solid cash runway. Companies can raise capital through either debt or equity. Commonly, a business will sell new shares in itself to raise cash and drive growth. By looking at a company's cash burn relative to its market capitalisation, we gain insight on how much shareholders would be diluted if the company needed to raise enough cash to cover another year's cash burn.
Warrego Energy has a market capitalisation of AU$147m and burnt through AU$35m last year, which is 24% of the company's market value. That's not insignificant, and if the company had to sell enough shares to fund another year's growth at the current share price, you'd likely witness fairly costly dilution.
How Risky Is Warrego Energy's Cash Burn Situation?
Even though its increasing cash burn makes us a little nervous, we are compelled to mention that we thought Warrego Energy's cash runway was relatively promising. Summing up, we think the Warrego Energy's cash burn is a risk, based on the factors we mentioned in this article. On another note, we conducted an in-depth investigation of the company, and identified 5 warning signs for Warrego Energy (1 doesn't sit too well with us!) that you should be aware of before investing here.
Of course, you might find a fantastic investment by looking elsewhere. So take a peek at this free list of interesting companies, and this list of stocks growth stocks (according to analyst forecasts)
Have feedback on this article? Concerned about the content? Get in touch with us directly. Alternatively, email editorial-team (at) simplywallst.com.
This article by Simply Wall St is general in nature. We provide commentary based on historical data and analyst forecasts only using an unbiased methodology and our articles are not intended to be financial advice. It does not constitute a recommendation to buy or sell any stock, and does not take account of your objectives, or your financial situation. We aim to bring you long-term focused analysis driven by fundamental data. Note that our analysis may not factor in the latest price-sensitive company announcements or qualitative material. Simply Wall St has no position in any stocks mentioned.
