
 Yahoo Finance
 We Think RedFlow (ASX:RFX) Can Afford To Drive Business Growth
Even when a business is losing money, it's possible for shareholders to make money if they buy a good business at the right price. For example, although software-as-a-service business Salesforce.com lost money for years while it grew recurring revenue, if you held shares since 2005, you'd have done very well indeed. But while history lauds those rare successes, those that fail are often forgotten; who remembers Pets.com?
So, the natural question for RedFlow (ASX:RFX) shareholders is whether they should be concerned by its rate of cash burn. For the purposes of this article, cash burn is the annual rate at which an unprofitable company spends cash to fund its growth; its negative free cash flow. The first step is to compare its cash burn with its cash reserves, to give us its 'cash runway'.
Check out our latest analysis for RedFlow
Does RedFlow Have A Long Cash Runway?
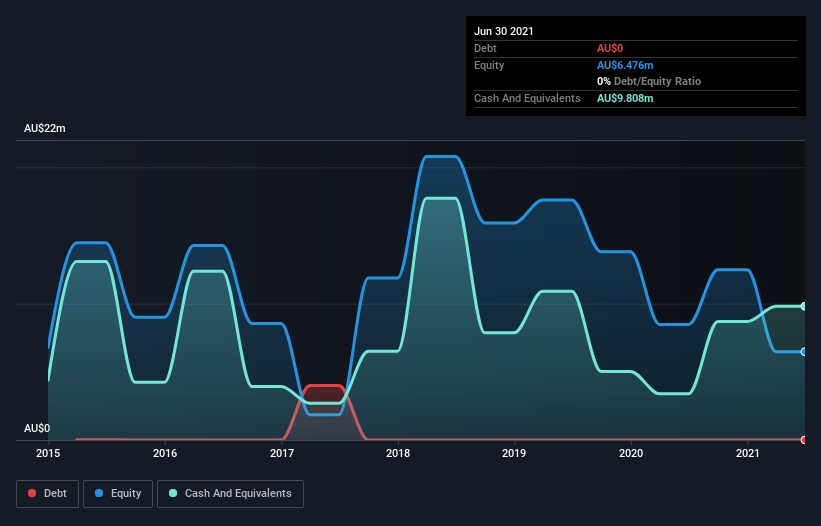
A company's cash runway is the amount of time it would take to burn through its cash reserves at its current cash burn rate. When RedFlow last reported its balance sheet in June 2021, it had zero debt and cash worth AU$9.8m. In the last year, its cash burn was AU$5.1m. So it had a cash runway of approximately 23 months from June 2021. That's not too bad, but it's fair to say the end of the cash runway is in sight, unless cash burn reduces drastically. You can see how its cash balance has changed over time in the image below.
How Well Is RedFlow Growing?
It was fairly positive to see that RedFlow reduced its cash burn by 30% during the last year. Revenue also improved during the period, increasing by 14%. Considering the factors above, the company doesn’t fare badly when it comes to assessing how it is changing over time. Of course, we've only taken a quick look at the stock's growth metrics, here. You can take a look at how RedFlow has developed its business over time by checking this visualization of its revenue and earnings history.
How Hard Would It Be For RedFlow To Raise More Cash For Growth?
Even though it seems like RedFlow is developing its business nicely, we still like to consider how easily it could raise more money to accelerate growth. Issuing new shares, or taking on debt, are the most common ways for a listed company to raise more money for its business. Many companies end up issuing new shares to fund future growth. By comparing a company's annual cash burn to its total market capitalisation, we can estimate roughly how many shares it would have to issue in order to run the company for another year (at the same burn rate).
Since it has a market capitalisation of AU$72m, RedFlow's AU$5.1m in cash burn equates to about 7.1% of its market value. That's a low proportion, so we figure the company would be able to raise more cash to fund growth, with a little dilution, or even to simply borrow some money.
So, Should We Worry About RedFlow's Cash Burn?
RedFlow appears to be in pretty good health when it comes to its cash burn situation. Not only was its cash runway quite good, but its cash burn relative to its market cap was a real positive. Based on the factors mentioned in this article, we think its cash burn situation warrants some attention from shareholders, but we don't think they should be worried. Taking an in-depth view of risks, we've identified 4 warning signs for RedFlow that you should be aware of before investing.
Of course, you might find a fantastic investment by looking elsewhere. So take a peek at this free list of interesting companies, and this list of stocks growth stocks (according to analyst forecasts)
Have feedback on this article? Concerned about the content? Get in touch with us directly. Alternatively, email editorial-team (at) simplywallst.com.
This article by Simply Wall St is general in nature. We provide commentary based on historical data and analyst forecasts only using an unbiased methodology and our articles are not intended to be financial advice. It does not constitute a recommendation to buy or sell any stock, and does not take account of your objectives, or your financial situation. We aim to bring you long-term focused analysis driven by fundamental data. Note that our analysis may not factor in the latest price-sensitive company announcements or qualitative material. Simply Wall St has no position in any stocks mentioned.
