
 Yahoo Finance
 We Think Lundin Gold (TSE:LUG) Might Have The DNA Of A Multi-Bagger
What are the early trends we should look for to identify a stock that could multiply in value over the long term? Firstly, we'll want to see a proven return on capital employed (ROCE) that is increasing, and secondly, an expanding base of capital employed. Put simply, these types of businesses are compounding machines, meaning they are continually reinvesting their earnings at ever-higher rates of return. Speaking of which, we noticed some great changes in Lundin Gold's (TSE:LUG) returns on capital, so let's have a look.
Understanding Return On Capital Employed (ROCE)
For those that aren't sure what ROCE is, it measures the amount of pre-tax profits a company can generate from the capital employed in its business. To calculate this metric for Lundin Gold, this is the formula:
Return on Capital Employed = Earnings Before Interest and Tax (EBIT) ÷ (Total Assets - Current Liabilities)
0.26 = US$334m ÷ (US$1.6b - US$322m) (Based on the trailing twelve months to September 2021).
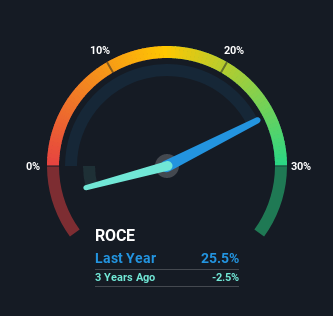
So, Lundin Gold has an ROCE of 26%. In absolute terms that's a great return and it's even better than the Metals and Mining industry average of 5.0%.
Check out our latest analysis for Lundin Gold
Above you can see how the current ROCE for Lundin Gold compares to its prior returns on capital, but there's only so much you can tell from the past. If you'd like, you can check out the forecasts from the analysts covering Lundin Gold here for free.
So How Is Lundin Gold's ROCE Trending?
Lundin Gold has recently broken into profitability so their prior investments seem to be paying off. The company was generating losses five years ago, but now it's earning 26% which is a sight for sore eyes. And unsurprisingly, like most companies trying to break into the black, Lundin Gold is utilizing 345% more capital than it was five years ago. This can indicate that there's plenty of opportunities to invest capital internally and at ever higher rates, both common traits of a multi-bagger.
On a side note, we noticed that the improvement in ROCE appears to be partly fueled by an increase in current liabilities. Effectively this means that suppliers or short-term creditors are now funding 20% of the business, which is more than it was five years ago. It's worth keeping an eye on this because as the percentage of current liabilities to total assets increases, some aspects of risk also increase.
The Bottom Line
In summary, it's great to see that Lundin Gold has managed to break into profitability and is continuing to reinvest in its business. And with a respectable 93% awarded to those who held the stock over the last five years, you could argue that these developments are starting to get the attention they deserve. So given the stock has proven it has promising trends, it's worth researching the company further to see if these trends are likely to persist.
If you'd like to know more about Lundin Gold, we've spotted 2 warning signs, and 1 of them makes us a bit uncomfortable.
If you'd like to see other companies earning high returns, check out our free list of companies earning high returns with solid balance sheets here.
Have feedback on this article? Concerned about the content? Get in touch with us directly. Alternatively, email editorial-team (at) simplywallst.com.
This article by Simply Wall St is general in nature. We provide commentary based on historical data and analyst forecasts only using an unbiased methodology and our articles are not intended to be financial advice. It does not constitute a recommendation to buy or sell any stock, and does not take account of your objectives, or your financial situation. We aim to bring you long-term focused analysis driven by fundamental data. Note that our analysis may not factor in the latest price-sensitive company announcements or qualitative material. Simply Wall St has no position in any stocks mentioned.
