
 Yahoo Finance
 We Think Bannerman Energy (ASX:BMN) Can Afford To Drive Business Growth
Just because a business does not make any money, does not mean that the stock will go down. Indeed, Bannerman Energy (ASX:BMN) stock is up 157% in the last year, providing strong gains for shareholders. Nonetheless, only a fool would ignore the risk that a loss making company burns through its cash too quickly.
So notwithstanding the buoyant share price, we think it's well worth asking whether Bannerman Energy's cash burn is too risky. In this report, we will consider the company's annual negative free cash flow, henceforth referring to it as the 'cash burn'. First, we'll determine its cash runway by comparing its cash burn with its cash reserves.
Check out our latest analysis for Bannerman Energy
How Long Is Bannerman Energy's Cash Runway?
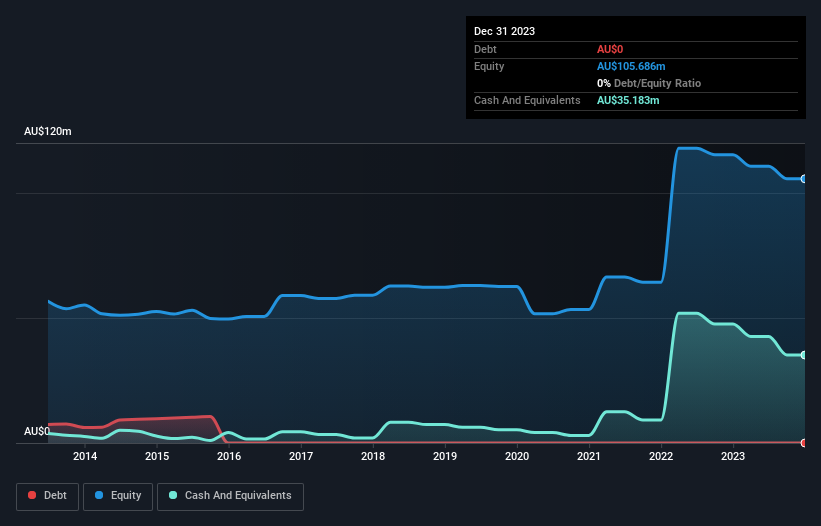
A cash runway is defined as the length of time it would take a company to run out of money if it kept spending at its current rate of cash burn. When Bannerman Energy last reported its December 2023 balance sheet in March 2024, it had zero debt and cash worth AU$35m. In the last year, its cash burn was AU$12m. Therefore, from December 2023 it had 2.9 years of cash runway. Importantly, analysts think that Bannerman Energy will reach cashflow breakeven in 4 years. Essentially, that means the company will either reduce its cash burn, or else require more cash. Depicted below, you can see how its cash holdings have changed over time.
How Is Bannerman Energy's Cash Burn Changing Over Time?
Although Bannerman Energy reported revenue of AU$1.4m last year, it didn't actually have any revenue from operations. To us, that makes it a pre-revenue company, so we'll look to its cash burn trajectory as an assessment of its cash burn situation. During the last twelve months, its cash burn actually ramped up 54%. While this spending increase is no doubt intended to drive growth, if the trend continues the company's cash runway will shrink very quickly. While the past is always worth studying, it is the future that matters most of all. So you might want to take a peek at how much the company is expected to grow in the next few years.
How Hard Would It Be For Bannerman Energy To Raise More Cash For Growth?
Given its cash burn trajectory, Bannerman Energy shareholders may wish to consider how easily it could raise more cash, despite its solid cash runway. Issuing new shares, or taking on debt, are the most common ways for a listed company to raise more money for its business. Many companies end up issuing new shares to fund future growth. By comparing a company's annual cash burn to its total market capitalisation, we can estimate roughly how many shares it would have to issue in order to run the company for another year (at the same burn rate).
Since it has a market capitalisation of AU$556m, Bannerman Energy's AU$12m in cash burn equates to about 2.2% of its market value. That means it could easily issue a few shares to fund more growth, and might well be in a position to borrow cheaply.
So, Should We Worry About Bannerman Energy's Cash Burn?
As you can probably tell by now, we're not too worried about Bannerman Energy's cash burn. In particular, we think its cash runway stands out as evidence that the company is well on top of its spending. Although its increasing cash burn does give us reason for pause, the other metrics we discussed in this article form a positive picture overall. Shareholders can take heart from the fact that analysts are forecasting it will reach breakeven. After taking into account the various metrics mentioned in this report, we're pretty comfortable with how the company is spending its cash, as it seems on track to meet its needs over the medium term. Taking a deeper dive, we've spotted 3 warning signs for Bannerman Energy you should be aware of, and 2 of them shouldn't be ignored.
If you would prefer to check out another company with better fundamentals, then do not miss this free list of interesting companies, that have HIGH return on equity and low debt or this list of stocks which are all forecast to grow.
Have feedback on this article? Concerned about the content? Get in touch with us directly. Alternatively, email editorial-team (at) simplywallst.com.
This article by Simply Wall St is general in nature. We provide commentary based on historical data and analyst forecasts only using an unbiased methodology and our articles are not intended to be financial advice. It does not constitute a recommendation to buy or sell any stock, and does not take account of your objectives, or your financial situation. We aim to bring you long-term focused analysis driven by fundamental data. Note that our analysis may not factor in the latest price-sensitive company announcements or qualitative material. Simply Wall St has no position in any stocks mentioned.
