
 Yahoo Finance
 There's Been No Shortage Of Growth Recently For Seven Group Holdings' (ASX:SVW) Returns On Capital
Did you know there are some financial metrics that can provide clues of a potential multi-bagger? One common approach is to try and find a company with returns on capital employed (ROCE) that are increasing, in conjunction with a growing amount of capital employed. Put simply, these types of businesses are compounding machines, meaning they are continually reinvesting their earnings at ever-higher rates of return. So on that note, Seven Group Holdings (ASX:SVW) looks quite promising in regards to its trends of return on capital.
Understanding Return On Capital Employed (ROCE)
If you haven't worked with ROCE before, it measures the 'return' (pre-tax profit) a company generates from capital employed in its business. The formula for this calculation on Seven Group Holdings is:
Return on Capital Employed = Earnings Before Interest and Tax (EBIT) ÷ (Total Assets - Current Liabilities)
0.15 = AU$1.6b ÷ (AU$14b - AU$3.1b) (Based on the trailing twelve months to June 2022).
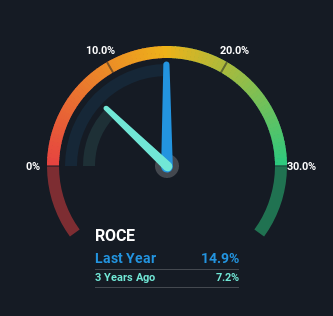
Thus, Seven Group Holdings has an ROCE of 15%. On its own, that's a standard return, however it's much better than the 12% generated by the Trade Distributors industry.
See our latest analysis for Seven Group Holdings
Above you can see how the current ROCE for Seven Group Holdings compares to its prior returns on capital, but there's only so much you can tell from the past. If you'd like, you can check out the forecasts from the analysts covering Seven Group Holdings here for free.
So How Is Seven Group Holdings' ROCE Trending?
Seven Group Holdings is displaying some positive trends. The numbers show that in the last five years, the returns generated on capital employed have grown considerably to 15%. The company is effectively making more money per dollar of capital used, and it's worth noting that the amount of capital has increased too, by 153%. This can indicate that there's plenty of opportunities to invest capital internally and at ever higher rates, a combination that's common among multi-baggers.
What We Can Learn From Seven Group Holdings' ROCE
All in all, it's terrific to see that Seven Group Holdings is reaping the rewards from prior investments and is growing its capital base. And investors seem to expect more of this going forward, since the stock has rewarded shareholders with a 59% return over the last five years. With that being said, we still think the promising fundamentals mean the company deserves some further due diligence.
Seven Group Holdings does have some risks, we noticed 3 warning signs (and 1 which doesn't sit too well with us) we think you should know about.
If you want to search for solid companies with great earnings, check out this free list of companies with good balance sheets and impressive returns on equity.
Have feedback on this article? Concerned about the content? Get in touch with us directly. Alternatively, email editorial-team (at) simplywallst.com.
This article by Simply Wall St is general in nature. We provide commentary based on historical data and analyst forecasts only using an unbiased methodology and our articles are not intended to be financial advice. It does not constitute a recommendation to buy or sell any stock, and does not take account of your objectives, or your financial situation. We aim to bring you long-term focused analysis driven by fundamental data. Note that our analysis may not factor in the latest price-sensitive company announcements or qualitative material. Simply Wall St has no position in any stocks mentioned.
Join A Paid User Research Session
You’ll receive a US$30 Amazon Gift card for 1 hour of your time while helping us build better investing tools for the individual investors like yourself. Sign up here
