
 Yahoo Finance
 There's Been No Shortage Of Growth Recently For Gale Pacific's (ASX:GAP) Returns On Capital
Finding a business that has the potential to grow substantially is not easy, but it is possible if we look at a few key financial metrics. One common approach is to try and find a company with returns on capital employed (ROCE) that are increasing, in conjunction with a growing amount of capital employed. Put simply, these types of businesses are compounding machines, meaning they are continually reinvesting their earnings at ever-higher rates of return. Speaking of which, we noticed some great changes in Gale Pacific's (ASX:GAP) returns on capital, so let's have a look.
Return On Capital Employed (ROCE): What is it?
Just to clarify if you're unsure, ROCE is a metric for evaluating how much pre-tax income (in percentage terms) a company earns on the capital invested in its business. Analysts use this formula to calculate it for Gale Pacific:
Return on Capital Employed = Earnings Before Interest and Tax (EBIT) ÷ (Total Assets - Current Liabilities)
0.15 = AU$19m ÷ (AU$180m - AU$53m) (Based on the trailing twelve months to December 2020).
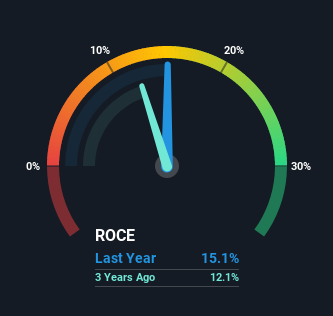
So, Gale Pacific has an ROCE of 15%. In absolute terms, that's a pretty standard return but compared to the Consumer Durables industry average it falls behind.
See our latest analysis for Gale Pacific
While the past is not representative of the future, it can be helpful to know how a company has performed historically, which is why we have this chart above. If you're interested in investigating Gale Pacific's past further, check out this free graph of past earnings, revenue and cash flow.
The Trend Of ROCE
The trends we've noticed at Gale Pacific are quite reassuring. The numbers show that in the last five years, the returns generated on capital employed have grown considerably to 15%. Basically the business is earning more per dollar of capital invested and in addition to that, 28% more capital is being employed now too. So we're very much inspired by what we're seeing at Gale Pacific thanks to its ability to profitably reinvest capital.
What We Can Learn From Gale Pacific's ROCE
To sum it up, Gale Pacific has proven it can reinvest in the business and generate higher returns on that capital employed, which is terrific. And with a respectable 54% awarded to those who held the stock over the last five years, you could argue that these developments are starting to get the attention they deserve. With that being said, we still think the promising fundamentals mean the company deserves some further due diligence.
One more thing to note, we've identified 2 warning signs with Gale Pacific and understanding these should be part of your investment process.
If you want to search for solid companies with great earnings, check out this free list of companies with good balance sheets and impressive returns on equity.
This article by Simply Wall St is general in nature. It does not constitute a recommendation to buy or sell any stock, and does not take account of your objectives, or your financial situation. We aim to bring you long-term focused analysis driven by fundamental data. Note that our analysis may not factor in the latest price-sensitive company announcements or qualitative material. Simply Wall St has no position in any stocks mentioned.
Have feedback on this article? Concerned about the content? Get in touch with us directly. Alternatively, email editorial-team (at) simplywallst.com.
