
 Yahoo Finance
 There's Been No Shortage Of Growth Recently For Red River Resources' (ASX:RVR) Returns On Capital
Did you know there are some financial metrics that can provide clues of a potential multi-bagger? In a perfect world, we'd like to see a company investing more capital into its business and ideally the returns earned from that capital are also increasing. This shows us that it's a compounding machine, able to continually reinvest its earnings back into the business and generate higher returns. So when we looked at Red River Resources (ASX:RVR) and its trend of ROCE, we really liked what we saw.
Understanding Return On Capital Employed (ROCE)
Just to clarify if you're unsure, ROCE is a metric for evaluating how much pre-tax income (in percentage terms) a company earns on the capital invested in its business. To calculate this metric for Red River Resources, this is the formula:
Return on Capital Employed = Earnings Before Interest and Tax (EBIT) ÷ (Total Assets - Current Liabilities)
0.022 = AU$1.8m ÷ (AU$110m - AU$28m) (Based on the trailing twelve months to December 2021).
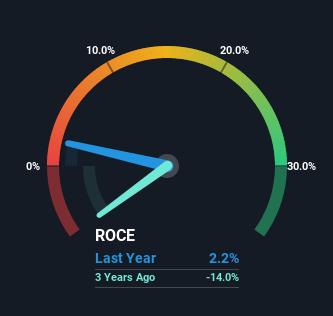
So, Red River Resources has an ROCE of 2.2%. Ultimately, that's a low return and it under-performs the Metals and Mining industry average of 8.7%.
See our latest analysis for Red River Resources
Above you can see how the current ROCE for Red River Resources compares to its prior returns on capital, but there's only so much you can tell from the past. If you'd like, you can check out the forecasts from the analysts covering Red River Resources here for free.
What Can We Tell From Red River Resources' ROCE Trend?
Red River Resources has recently broken into profitability so their prior investments seem to be paying off. The company was generating losses five years ago, but now it's earning 2.2% which is a sight for sore eyes. And unsurprisingly, like most companies trying to break into the black, Red River Resources is utilizing 92% more capital than it was five years ago. This can indicate that there's plenty of opportunities to invest capital internally and at ever higher rates, both common traits of a multi-bagger.
For the record though, there was a noticeable increase in the company's current liabilities over the period, so we would attribute some of the ROCE growth to that. Effectively this means that suppliers or short-term creditors are now funding 25% of the business, which is more than it was five years ago. It's worth keeping an eye on this because as the percentage of current liabilities to total assets increases, some aspects of risk also increase.
What We Can Learn From Red River Resources' ROCE
In summary, it's great to see that Red River Resources has managed to break into profitability and is continuing to reinvest in its business. Given the stock has declined 33% in the last five years, this could be a good investment if the valuation and other metrics are also appealing. That being the case, research into the company's current valuation metrics and future prospects seems fitting.
One more thing to note, we've identified 2 warning signs with Red River Resources and understanding them should be part of your investment process.
If you want to search for solid companies with great earnings, check out this free list of companies with good balance sheets and impressive returns on equity.
Have feedback on this article? Concerned about the content? Get in touch with us directly. Alternatively, email editorial-team (at) simplywallst.com.
This article by Simply Wall St is general in nature. We provide commentary based on historical data and analyst forecasts only using an unbiased methodology and our articles are not intended to be financial advice. It does not constitute a recommendation to buy or sell any stock, and does not take account of your objectives, or your financial situation. We aim to bring you long-term focused analysis driven by fundamental data. Note that our analysis may not factor in the latest price-sensitive company announcements or qualitative material. Simply Wall St has no position in any stocks mentioned.
