
 Yahoo Finance
 Texas new homes selling at “breakneck speed”
HomesUSA.com reports record inventory lows push new home prices higher
Chart 1: Texas New Homes Tracking - Days on Market – Sept. 2021
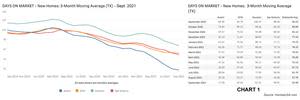
The HomesUSA.com New Home Sales Index showed the 3-month moving average of Days on Market fell in all four of Texas’s major new home markets
Chart 2: Texas New Home Sales – Sept. 2021
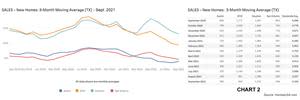
Total new home sales, solely based on MLS data, were lower statewide in Texas and three of the four major new home markets last month, according to the 3-month moving average.
Chart 3: Texas New Home Sales Prices – Sept. 2021
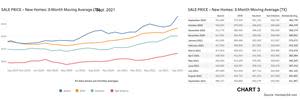
Low inventory of new homes helped drive up the average price of new homes in Texas and in its four major new home markets.
Chart 4: Texas Sales-to-List-Price Ratio – Sept. 2021
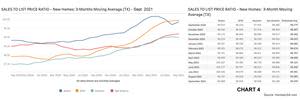
New home sales statewide and in Dallas-Ft. Worth, Houston, Austin, and San Antonio were close to the asking price.
Chart 5: Texas Pending New Home Sales – Sept. 2021
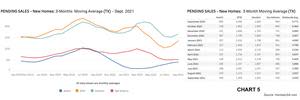
Based solely on MLS data, pending new home sales posted higher numbers statewide and in all four major new home markets in Texas.
Chart 6: Texas Active Listings for New Homes – Sept. 2021
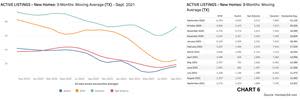
MLS data shows the 3-month moving average for active listings statewide rebounded in September, with 13,301 versus 11,983 in August.
Chart A: Texas 12-Month Moving Averages – New Homes – Sept. 2021

The monthly HomesUSA.com report includes both 3-month and 12-month moving averages for all essential market data, including Days on Market, sales volume, sales prices, a sales-to-list price ratio, pending sales, and active listings. The 3-month moving average indices track market seasonality, while the 12-month moving average removes the seasonality and tracks the longer trend.
Ben Caballero, HomesUSA.com

Ben Caballero, founder and CEO of HomesUSA.com, twice has been recognized by Guinness World Record title for "Most annual home sale transactions through MLS by an individual sell side real estate agent." Ranked by REAL Trends as America's top real estate agent for home sales since 2013, Ben is the most productive real estate agent in U.S. history.
DALLAS, Oct. 21, 2021 (GLOBE NEWSWIRE) -- New homes in Texas set a new record sales pace last month, according to a new monthly report from HomesUSA.com. In Austin, new homes were on the market for an average of 17 days last month, down from 83 days one year ago, according to the 3-month moving average of the HomesUSA.com New Home Sales Index. Statewide average pace for new homes was 54 days, the fastest recorded and down from 93 days last September.
The Dallas-based HomesUSA.com September new homes report, which includes Dallas-Ft. Worth, Houston, Austin, and San Antonio, is based on data from the North Texas Real Estate Information Systems, Houston Association of REALTORS, Austin Board of REALTORS Multiple Listing Services, and San Antonio Board of REALTORS.
“The Texas new homes sales market is moving at breakneck speed,” said Ben Caballero, owner of HomesUSA.com and world record holder for most home sales. “Builders are building homes as fast as they can, but record low inventory continues to push prices higher,” Caballero explained.
Caballero notes that between 1959 and 2007, the US built an average of 1.1 million single-family US homes annually. However, since 2007, the nation has failed to reach that 48-year annual average, creating a shortage of 5.5 million homes.
“Population growth is driving the sale of new homes,” Caballero explains, noting Dallas-Ft. Worth alone added 120,000 people from July 2020 to July 2021, including 75,000 relocations.
In Dallas-Ft. Worth, the 3-month moving average for Days on Market was 52 days in September, down from 86 days in September 2020. Likewise, San Antonio’s DOM fell to 49 days last month, down from 88 days the year before. The DOM in Houston fell to 67 days in September, dropping from 106 days last September. All DOM reports are the lowest recorded since the launch of the HomesUSA.com New Home Sales Index in 2017 and are believed to be the fastest sales pace ever.
“Typically,” Caballero notes, “Days on Market averages are higher for new homes than resale homes by about 60 days due to construction time. But now new homes are selling so fast, builders are not listing homes until they know their construction costs.” As a result, the DOM for new homes has “closed the gap” and is currently closer to the resale market than ever recorded. Caballero adds that new homes are selling as much as five times faster than they have in recent years.
Low inventory is driving new home prices higher. For the second month in a row, the 3-month moving average for a new home broke the $400,000 price barrier, averaging $411,967 in September and $401,601 in August. The average new home price was higher in all four of the state's major new home markets last month.
Caballero explains that providing the most current and comprehensive information about Texas' new home sales remains an ongoing challenge. “The market is so hot the majority of new homes are not entered into the MLS (Multiple Listing Service),” Caballero said. “But the HomesUSA.com report uses the MLS data because it is the most accurate and timely new home sales data available, no other source captures new homes sales activity so quickly.”
Except for Austin’s small up blip, local MLS data shows new home sales continue to fall but that is likely a result of limited MLS inventory not because builders are actually selling fewer homes, according to Caballero. The 3-month moving average for new sales in Texas was 3,104 last month versus 3,247 in August. Austin reported new home sales totaling 392 for September versus 349 for August. Total home sales as recorded by local MLSs declined in Dallas-Ft. Worth, Houston, and San Antonio.
“The good news is that MLS data does shows Texas pending new home sales are rebounding which may forecast the market is moving more towards supply and demand balance,” Caballero said. The 3-month moving average of pending new home sales statewide in September was 3,932 versus 3,507 in August. Still, putting these numbers in perspective, Caballero notes that pending sales statewide totaled 5,771 a year ago in September.
According to the MLS data, the 3-month moving average for active listings was up for the second month in a row, with September posting 13,301 listings versus 11,983 in August.
"While the MLS numbers are not showing the complete picture, it still offers the most current data available," Caballero said.
Caballero is sharing the HomesUSA.com New Homes Report in advance of the release by the Commerce Department of its nationwide New Residential Sales Report for September 2021, set for Tuesday, October 26 at 10:00 am Eastern.
Caballero noted the monthly HomesUSA.com report includes both 3-month and 12-month moving averages for all essential market data, including Days on Market, sales volume, sales prices, a sales-to-list price ratio, pending sales, and active listings. The 3-month moving average indices track market seasonality, while the 12-month moving average removes the seasonality and tracks the longer trend.
Days on Market – New Homes in Texas (Exclusive Data)
The HomesUSA.com New Home Sales Index showed the 3-month moving average of Days on Market fell in all four of Texas’s major new home markets. Austin's DOM was 17.29 days in September versus 20.18 days in August. Houston’s DOM was 67.31 days in September versus 72.50 days in August. In San Antonio, the DOM was 48.97 days in September versus 52.66 days in August. The DOM for Dallas-Ft. Worth was 52 days in September versus 53.17 days in August. (See Chart 1: Texas New Homes Days on Market)
Texas New Home Sales Data
Total new home sales, solely based on MLS data, were lower statewide in Texas and three of the four major new home markets last month, according to the 3-month moving average. In Dallas-Ft. Worth, September sales were 943 versus 991 in August. Houston sales were 1,310 in September versus 1,398 in August. San Antonio posted September sales of 458 versus 508 in August. Austin was the anomaly as September sales totaled 392 versus 349 in August. (See Chart 2: Texas New Home Sales)
Texas New Home Prices
Low inventory of new homes helped drive up the average price of new homes in Texas and in its four major new home markets. Austin's 3-month moving average price – the highest among the top four markets – was $480,157 in September versus $443,374 in August. Dallas-Ft. Worth reported its 3-month moving average price for new homes was $433,882 in September versus $425,751 in August. In Houston, the average new home price was $402,578 in September versus $401,315 in August. Also, the San Antonio average new home price in September was $332,362 versus $327,299 in August. (See Chart 3: Texas New Home Prices)
Texas Sales-to-List Price Ratio
New home sales statewide and in Dallas-Ft. Worth, Houston, Austin, and San Antonio were close to the asking price. Statewide, the 3-month moving average of the sales-to-list price ratio in September was 99.430 percent versus 99.393 percent in August. In Dallas-Ft. Worth, it was 99.954 percent in September versus 99.918 percent in August. In Houston, it was 98.990 percent in September versus 99.035 percent in August. San Antonio's ratio was 99.198 percent last month versus 99.151 percent in August. In Austin, the sales-to-price ratio was 99.868 percent in September versus 99.151 percent in August. (See Chart 4: Texas Sales-to-List Price Ratio)
Texas Pending New Homes Sales Data
Based solely on MLS data, pending new home sales posted higher numbers statewide and in all four major new home markets in Texas. Statewide MLS data shows pending sales in September were 3,932 versus 3,507 in August. Houston’s September pending sales were 1,650 versus 1,517 in August. Dallas-Ft. Worth pending sales in September were 1,343 versus 1,113 in August. In San Antonio, pending sales last month were 530 versus 507 in August. Austin's pending sales in September were 409 versus 370 in August. (See Chart 5: Texas Pending New Home Sales)
Texas Active Listings for New Homes
MLS data shows the 3-month moving average for active listings statewide rebounded in September, with 13,301 versus 11,983 in August. All four major Texas new home markets – Dallas-Ft. Worth, Houston, Austin, and San Antonio – posted higher active listings last month. Dallas-Ft. Worth active listings in September were 2,575 versus 2,307 in August. In Houston, last month’s active listings were 7,234 versus 6,565 in August. Austin’s active listings were 1,603 in September versus 1,432 in August. San Antonio reported active new home listings last month were 1,889 versus 1,680 in August. (See Chart 6: Texas Active Listings and Chart A: 12-Month Moving Averages)
About the HomesUSA.com New Home Sales Index
The HomesUSA.com Index is reported as both a 3-month and 12-month moving average of the Days on Market (DOM) for new homes listed in the local Multiple Listing Services (MLSs) for the four largest Texas markets, including Dallas-Ft. Worth, Houston, Austin, and San Antonio. Created by Ben Caballero, founder and CEO of HomesUSA.com, it is the first Days on Market index to track Texas's new home market and includes homes listed while under construction.
About Ben Caballero and HomesUSA.com®
Ben Caballero, founder and CEO of HomesUSA.com, is the world record holder for "Most annual home sale transactions through MLS by an individual sell-side real estate agent." Ranked by REAL Trends as America's top real estate agent for home sales since 2013, Ben is the most productive real estate agent in U.S. history. He is the only agent to exceed $1 billion in residential sales transactions in a single year, a feat first achieved in 2015 and repeated each year through 2018 when he achieved more than $2 billion. An award-winning innovator and technology pioneer, Ben works with more than 60 home builders in Dallas-Fort Worth, Houston, Austin, and San Antonio. His podcast series is available on iTunes and Google Podcasts. An infographic illustrating Ben’s sales production is here. Learn more at HomesUSA.com |Twitter: @bcaballero - @HomesUSA | Facebook: /HomesUSAdotcom.
Note for journalists: You may contact Ben Caballero directly on his cell at (214) 616-9222 or by email at ben@homesusa.com.
"REALTOR® is a federally registered collective membership mark which identifies a real estate professional who is member of the NATIONAL ASSOCIATION OF REALTORS® and subscribes to its strict Code of Ethics."
Media Contact:
Kevin Hawkins
(206) 866-1220
kevin@wavgroup.com
Image: Ben Caballero
https://www.homesusa.com/wp-content/uploads/2018/09/Ben-Caballero-Portrait-Grey-4288x2848.jpg
Individual Chart images:
Chart 1: Texas New Homes Tracking - Days on Market – September 2021: https://homesusa.com/wp-content/uploads/2021/10/Chart-1-Texas-Days-on-Market.jpg
Chart 2: Texas New Home Sales – September 2021: https://homesusa.com/wp-content/uploads/2021/10/Chart-2-Texas-New-Home-Sales.jpg
Chart 3: Texas New Home Sales Prices – September 2021: https://homesusa.com/wp-content/uploads/2021/10/Chart-3-Texas-New-Home-Sales-Prices.jpg
Chart 4: Texas Sales-to-List-Price Ratio – September 2021: https://homesusa.com/wp-content/uploads/2021/10/Chart-4-Texas-Sales-to-List-Price-Ratio.jpg
Chart 5: Texas Pending New Home Sales – September 2021: https://homesusa.com/wp-content/uploads/2021/10/Chart-5-Texas-Pending-New-Home-Sales.jpg
Chart 6: Texas Active Listings for New Homes – September 2021: https://homesusa.com/wp-content/uploads/2021/10/Chart-6-Texas-Active-Listings.jpg
Chart A: Texas 12-Month Moving Averages – New Homes – September 2021: https://homesusa.com/wp-content/uploads/2021/10/Chart-A-12MonthChart-DataOnly.jpg

