
 Yahoo Finance
 Texas new homes prices jump as Days on Market fall
HomesUSA.com reports another record pace for “fast and furious” new home sales
Chart 1: Texas New Homes: Days on Market - August 2021
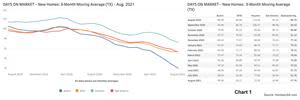
The HomesUSA.com New Home Sales Index showed the 3-month moving average of Days on Market fell in all four of Texas’s major new home markets.
Chart 2: Texas New Home Sales - August 2021

Total new home sales solely based on MLS data declined statewide in Texas and all four major new home markets last month, according to the 3-month moving average.
Chart 3: Texas New Home Sales Prices – August 2021

The average price of new homes rose in Texas's four major new home markets. Austin's 3-month moving average price – the highest among the top four markets – was $443,374 in August versus $437,693 in July.
Chart 4: Sales-to-List-Price Ratio Data for Texas New Homes - August 2021

New home sales statewide and in Dallas-Ft. Worth, Houston, and San Antonio were close to the asking price. Statewide, the 3-month moving average of the sales-to-list price ratio in August was 99.393 percent versus 99.391 percent in July.
Chart 5: Texas Pending New Homes Sales - August 2021

Based solely on MLS data, pending new home sales posted lower numbers statewide and all four major new home markets in Texas. Statewide MLS data shows pending sales in August were 2,796 versus 3,764 in July.
Chart 6: Active Listings for New Home Sales - August 2021
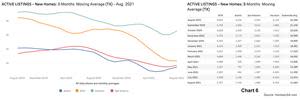
MLS data shows the 3-month moving average for active listings statewide in August was 11,983 versus 11,073 in July. Three of the four major Texas markets – Houston, Austin, and San Antonio – posted higher active listings last month.
Chart A - Texas New Home Sales: 12-Month Moving Averages - August 2021

The HomesUSA.com Index is reported as both a 3-month and 12-month moving average of the Days on Market (DOM) for new homes listed in the local Multiple Listing Services (MLSs) for the four largest Texas markets, including Dallas-Ft. Worth, Houston, Austin, and San Antonio.
Ben Caballero, founder and CEO of HomesUSA.com

Ben Caballero, founder and CEO of HomesUSA.com, holds the current Guinness World Record title for "Most annual home sale transactions through MLS by an individual sell side real estate agent." Ranked by REAL Trends as America's top real estate agent for home sales since 2013, Ben is the most productive real estate agent in U.S. history.
DALLAS, Sept. 21, 2021 (GLOBE NEWSWIRE) -- New homes in Texas continued to sell at a record pace last month, according to a new monthly report from HomesUSA.com. In Austin, new homes were on the market for an average of just 20 days last month, down from 86 days in August 2020, according to the 3-month moving average of the HomesUSA.com News Home Sales Index. Statewide average pace for new homes was 58 days, the fastest recorded since the release of the index and down from nearly 100 days in August 2020.
The HomesUSA.com August new homes report – covering Dallas-Ft. Worth, Houston, Austin, and San Antonio – is based on data from the North Texas Real Estate Information Systems, Houston Association of REALTORS, Austin Board of REALTORS Multiple Listing Services, and San Antonio Board of REALTORS.
“Like the popular movie franchise, Texas new homes sales are fast and furious,” said Ben Caballero, owner of HomesUSA.com and a current Guinness World Record title holder for home sales. “Prices are trending higher as demand continues to outstrip supply, even though builders are doing everything they can to build more homes,” Caballero explained.
In Dallas-Ft. Worth, the 3-month moving average for Days on Market was 53 days in August, down from 91 days in August 2020. Likewise, San Antonio’s DOM fell to 53 days in August, down from 92 days the year before. The DOM fell to 73 days in Houston in August, dropping from 110 days in August 2020.
HomesUSA.com first started tracking DOM data with the launch of its News Home Sales Index in 2017. Historically, Caballero said that days on market are higher for new homes than resale homes by about 60 days due to construction time. However, because builders are not listing homes until they know their construction costs, the new home’s DOM is much closer to the resale market. Today, he notes, new homes are selling as much as five times faster than they did in recent years.
Caballero also notes there was pressure on new home prices last month because of housing demand. The statewide 3-month moving average broke the $400,000 barrier for the first time, averaging $401,601 in August versus $391,122 in July. In addition, average new home prices were higher in all four of the state's major new home sales markets last month.
Caballero notes that providing the most current and comprehensive information about Texas' new home sales is challenging. “Today, we believe builders are selling homes so fast, the majority of new homes are not being entered into the MLS (Multiple Listing Service),” Caballero added. “While all the new home data we report comes from local MLSs and is the most accurate and timely, it does not capture all of the new homes sales activity.”
Based on local MLS data, new homes sales are falling. The 3-month moving average for new sales in Texas was 3,247 last month versus 3,608 in July. In addition, total home sales as recorded in the MLSs were lower in all four of the state’s major new home sales markets.
MLS data also shows Texas pending new home sales are trending down. The 3-month moving average of pending new home sales statewide in August was 2,796 versus 3,764 in July. Caballero notes that pending sales statewide totaled 6,328 in August 2020.
According to the MLS data, the 3-month moving average for active listings was up, with August posting 11,983 listings versus 11,073 in July.
"Unfortunately, right now, the MLS numbers are not showing the complete picture," As Caballero notes, builders are not reporting all new home sales, pending sales, and active listings to the MLS.
Caballero is sharing the HomesUSA.com New Homes Report in advance of the release by the Commerce Department of its nationwide New Residential Sales Report for August 2021, set for Friday, September 24 at 10:00 am Eastern.
Caballero noted the monthly HomesUSA.com report includes both 3-month and 12-month moving averages for all essential market data, including Days on Market, sales volume, sales prices, a sales-to-list price ratio, pending sales, and active listings. The 3-month moving average indices track market seasonality, while the 12-month moving average removes the seasonality and tracks the longer trend.
Days on Market – New Homes in Texas (Exclusive Data)
The HomesUSA.com New Home Sales Index showed the 3-month moving average of Days on Market fell in all four of Texas’s major new home markets. Austin's DOM was 20.18 days in August versus 28.54 days in July. Houston’s DOM was 72.50 days in August versus 77 days in July. In San Antonio, the DOM was 52.66 days in August versus 58.45 days in July. The DOM for Dallas-Ft. Worth was 53.17 days in August versus 53.32 days in July. (See Chart 1: Texas New Homes Days on Market)
Texas New Home Sales Data
Total new home sales solely based on MLS data declined statewide in Texas and all four major new home markets last month, according to the 3-month moving average. In Dallas-Ft. Worth, August sales were 991 versus 1,140 in July. Houston sales were 1,398 in August sales versus 1,548 in July. Austin’s August sales totaled 349 versus 375 in July. San Antonio posted August sales of 508 versus 544 in July. (See Chart 2: Texas New Home Sales)
Texas New Home Prices
The average price of new homes rose in Texas's four major new home markets. Austin's 3-month moving average price – the highest among the top four markets – was $443,374 in August versus $437,693 in July. Dallas-Ft. Worth reported its 3-month moving average price for new homes was $425,751 in August versus $414,444 in July. In Houston, the average new home price was $401,315 in August versus $387,712 in July. Also, the San Antonio average new home price in August was $327,299 versus $320,365 in July. (See Chart 3: Texas New Home Prices)
Texas Sales-to-List Price Ratio
New home sales statewide and in Dallas-Ft. Worth, Houston, and San Antonio were close to the asking price. Statewide, the 3-month moving average of the sales-to-list price ratio in August was 99.393 percent versus 99.391 percent in July. In Dallas-Ft. Worth, it was 99.918 percent in August versus 99.878 percent in July. In Houston, it was 99.035 percent in August versus 98.988 percent in July. San Antonio's ratio was 99.151 percent last month versus 99.075 percent in July. Austin was the anomaly, as the sales-to-price ratio decreased to 99.707 percent in August versus 100.026 percent in July. (See Chart 4: Texas Sales-to-List Price Ratio)
Texas Pending New Homes Sales Data
Based solely on MLS data, pending new home sales posted lower numbers statewide and all four major new home markets in Texas. Statewide MLS data shows pending sales in August were 2,796 versus 3,764 in July. Houston’s August pending sales were 1,172 versus 1,635 in July. Dallas-Ft. Worth pending sales in August were 905 versus 1,198 in July. In San Antonio, pending sales last month were 357 versus 517 in July. Austin's pending sales in August were 362 versus 413 in July. (See Chart 5: Texas Pending New Home Sales)
Texas Active Listings for New Homes
MLS data shows the 3-month moving average for active listings statewide in August was 11,983 versus 11,073 in July. Three of the four major Texas markets – Houston, Austin, and San Antonio – posted higher active listings last month. In Houston, last month’s active listings were 6,565 versus 6,050 in July. Austin’s active listings were 1,432 in August versus 1,196 in July. San Antonio reported active new home listings last month were 1,680 versus 1,489 in July. Dallas-Ft. Worth was the exception, as active listings in August were 2,307 versus 2,338 in July. (See Chart 6: Texas Active Listings and Chart A: 12-Month Moving Averages)
About the HomesUSA.com New Home Sales Index
The HomesUSA.com Index is reported as both a 3-month and 12-month moving average of the Days on Market (DOM) for new homes listed in the local Multiple Listing Services (MLSs) for the four largest Texas markets, including Dallas-Ft. Worth, Houston, Austin, and San Antonio. Created by Ben Caballero, founder and CEO of HomesUSA.com, it is the first Days on Market index to track Texas's new home market and includes homes listed while under construction.
About Ben Caballero and HomesUSA.com®
Ben Caballero, founder and CEO of HomesUSA.com, holds the current Guinness World Record title for "Most annual home sale transactions through MLS by an individual sell-side real estate agent." Ranked by REAL Trends as America's top real estate agent for home sales since 2013, Ben is the most productive real estate agent in U.S. history. He is the only agent to exceed $1 billion in residential sales transactions in a single year, a feat first achieved in 2015 and repeated each year through 2018 when he achieved more than $2 billion. An award-winning innovator and technology pioneer, Ben works with more than 60 home builders in Dallas-Fort Worth, Houston, Austin, and San Antonio. His podcast series is available on iTunes and Google Podcasts. An infographic illustrating Ben’s sales production is here. Learn more at HomesUSA.com |Twitter: @bcaballero - @HomesUSA | Facebook: /HomesUSAdotcom.
Note for journalists: You may contact Ben Caballero directly on his cell at (214) 616-9222 or by email at ben@homesusa.com.
"REALTOR® is a federally registered collective membership mark which identifies a real estate professional who is member of the NATIONAL ASSOCIATION OF REALTORS® and subscribes to its strict Code of Ethics."
Media Contact:
Kevin Hawkins
(206) 866-1220
kevin@wavgroup.com
Image: Ben Caballero
https://www.homesusa.com/wp-content/uploads/2018/09/Ben-Caballero-Portrait-Grey-4288x2848.jpg
Individual Chart images:
Chart 1: Texas New Homes Tracking - Days on Market – August 2021: https://homesusa.com/wp-content/uploads/2021/09/Chart-1-Texas-Days-on-Market.jpg
Chart 2: Texas New Home Sales – August 2021: https://homesusa.com/wp-content/uploads/2021/09/Chart-2-Texas-New-Home-Sales.jpg
Chart 3: Texas New Home Sales Prices – August 2021: https://homesusa.com/wp-content/uploads/2021/09/Chart-3-Texas-New-Home-Sales-Prices.jpg
Chart 4: Texas Sales-to-List-Price Ratio – August 2021: https://homesusa.com/wp-content/uploads/2021/09/Chart-4-Texas-Sales-to-List-Price-Ratio.jpg
Chart 5: Texas Pending New Home Sales – August 2021: https://homesusa.com/wp-content/uploads/2021/09/Chart-5-Texas-Pending-New-Home-Sales.jpg
Chart 6: Texas Active Listings for New Homes – August 2021: https://homesusa.com/wp-content/uploads/2021/09/Chart-6-Texas-Active-Listings.jpg
Chart A: Texas 12-Month Moving Averages – New Homes – August 2021: https://homesusa.com/wp-content/uploads/2021/09/Chart-A-12MonthChart-DataOnly.jpg

