
 Yahoo Finance
 What Is Tempur Sealy International's (NYSE:TPX) P/E Ratio After Its Share Price Tanked?

Unfortunately for some shareholders, the Tempur Sealy International (NYSE:TPX) share price has dived 36% in the last thirty days. Looking back further, the stock is up 3.6% in the last year.
Assuming nothing else has changed, a lower share price makes a stock more attractive to potential buyers. In the long term, share prices tend to follow earnings per share, but in the short term prices bounce around in response to short term factors (which are not always obvious). So, on certain occasions, long term focussed investors try to take advantage of pessimistic expectations to buy shares at a better price. One way to gauge market expectations of a stock is to look at its Price to Earnings Ratio (PE Ratio). Investors have optimistic expectations of companies with higher P/E ratios, compared to companies with lower P/E ratios.
View our latest analysis for Tempur Sealy International
How Does Tempur Sealy International's P/E Ratio Compare To Its Peers?
Tempur Sealy International's P/E of 16.86 indicates some degree of optimism towards the stock. As you can see below, Tempur Sealy International has a higher P/E than the average company (10.2) in the consumer durables industry.
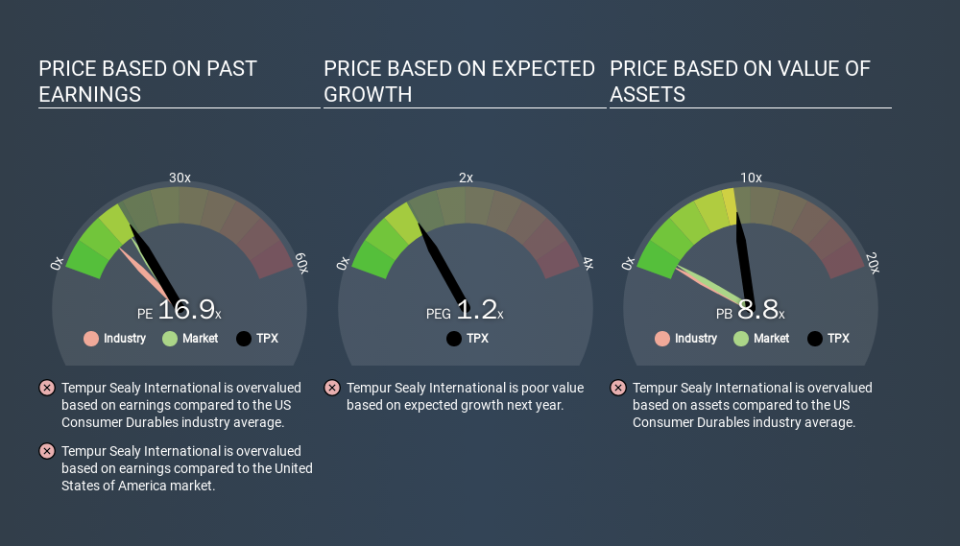
Tempur Sealy International's P/E tells us that market participants think the company will perform better than its industry peers, going forward. The market is optimistic about the future, but that doesn't guarantee future growth. So investors should always consider the P/E ratio alongside other factors, such as whether company directors have been buying shares.
How Growth Rates Impact P/E Ratios
P/E ratios primarily reflect market expectations around earnings growth rates. When earnings grow, the 'E' increases, over time. That means even if the current P/E is high, it will reduce over time if the share price stays flat. So while a stock may look expensive based on past earnings, it could be cheap based on future earnings.
In the last year, Tempur Sealy International grew EPS like Taylor Swift grew her fan base back in 2010; the 61% gain was both fast and well deserved.
Remember: P/E Ratios Don't Consider The Balance Sheet
Don't forget that the P/E ratio considers market capitalization. Thus, the metric does not reflect cash or debt held by the company. In theory, a company can lower its future P/E ratio by using cash or debt to invest in growth.
Spending on growth might be good or bad a few years later, but the point is that the P/E ratio does not account for the option (or lack thereof).
So What Does Tempur Sealy International's Balance Sheet Tell Us?
Tempur Sealy International's net debt equates to 44% of its market capitalization. While that's enough to warrant consideration, it doesn't really concern us.
The Bottom Line On Tempur Sealy International's P/E Ratio
Tempur Sealy International trades on a P/E ratio of 16.9, which is above its market average of 14.7. Its debt levels do not imperil its balance sheet and its EPS growth is very healthy indeed. So on this analysis a high P/E ratio seems reasonable. Given Tempur Sealy International's P/E ratio has declined from 26.4 to 16.9 in the last month, we know for sure that the market is significantly less confident about the business today, than it was back then. For those who prefer to invest with the flow of momentum, that might be a bad sign, but for a contrarian, it may signal opportunity.
Investors should be looking to buy stocks that the market is wrong about. People often underestimate remarkable growth -- so investors can make money when fast growth is not fully appreciated. So this free visualization of the analyst consensus on future earnings could help you make the right decision about whether to buy, sell, or hold.
Of course, you might find a fantastic investment by looking at a few good candidates. So take a peek at this free list of companies with modest (or no) debt, trading on a P/E below 20.
If you spot an error that warrants correction, please contact the editor at editorial-team@simplywallst.com. This article by Simply Wall St is general in nature. It does not constitute a recommendation to buy or sell any stock, and does not take account of your objectives, or your financial situation. Simply Wall St has no position in the stocks mentioned.
We aim to bring you long-term focused research analysis driven by fundamental data. Note that our analysis may not factor in the latest price-sensitive company announcements or qualitative material. Thank you for reading.
