
 Yahoo Finance
 Should You Be Tempted To Sell Tempur Sealy International, Inc. (NYSE:TPX) Because Of Its P/E Ratio?

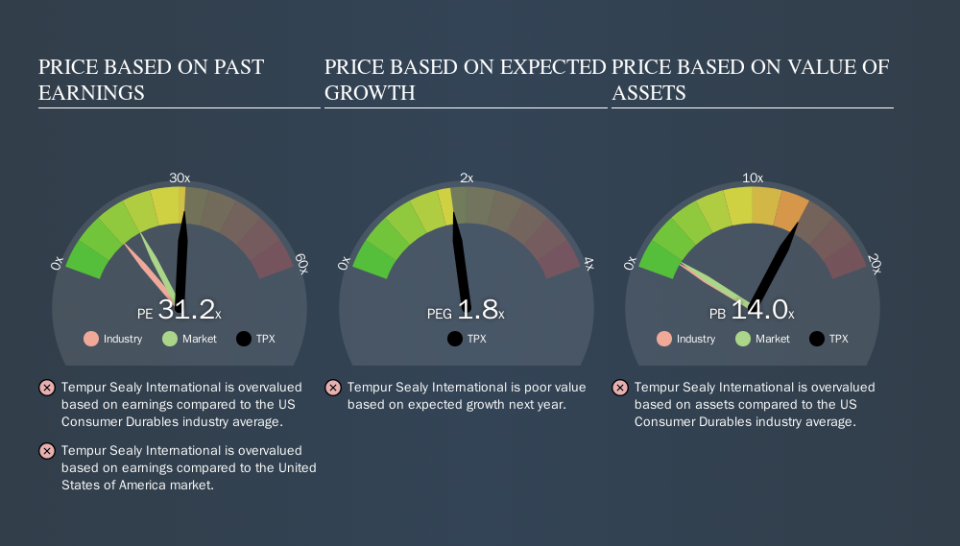
This article is for investors who would like to improve their understanding of price to earnings ratios (P/E ratios). We'll show how you can use Tempur Sealy International, Inc.'s (NYSE:TPX) P/E ratio to inform your assessment of the investment opportunity. Tempur Sealy International has a price to earnings ratio of 31.24, based on the last twelve months. That means that at current prices, buyers pay $31.24 for every $1 in trailing yearly profits.
Check out our latest analysis for Tempur Sealy International
How Do I Calculate A Price To Earnings Ratio?
The formula for price to earnings is:
Price to Earnings Ratio = Price per Share ÷ Earnings per Share (EPS)
Or for Tempur Sealy International:
P/E of 31.24 = $77.76 ÷ $2.49 (Based on the trailing twelve months to June 2019.)
Is A High Price-to-Earnings Ratio Good?
A higher P/E ratio means that buyers have to pay a higher price for each $1 the company has earned over the last year. That is not a good or a bad thing per se, but a high P/E does imply buyers are optimistic about the future.
How Does Tempur Sealy International's P/E Ratio Compare To Its Peers?
One good way to get a quick read on what market participants expect of a company is to look at its P/E ratio. As you can see below, Tempur Sealy International has a higher P/E than the average company (12.3) in the consumer durables industry.
That means that the market expects Tempur Sealy International will outperform other companies in its industry. The market is optimistic about the future, but that doesn't guarantee future growth. So further research is always essential. I often monitor director buying and selling.
How Growth Rates Impact P/E Ratios
P/E ratios primarily reflect market expectations around earnings growth rates. Earnings growth means that in the future the 'E' will be higher. And in that case, the P/E ratio itself will drop rather quickly. And as that P/E ratio drops, the company will look cheap, unless its share price increases.
Tempur Sealy International's earnings per share fell by 24% in the last twelve months. But over the longer term (5 years) earnings per share have increased by 10%.
A Limitation: P/E Ratios Ignore Debt and Cash In The Bank
Don't forget that the P/E ratio considers market capitalization. So it won't reflect the advantage of cash, or disadvantage of debt. The exact same company would hypothetically deserve a higher P/E ratio if it had a strong balance sheet, than if it had a weak one with lots of debt, because a cashed up company can spend on growth.
Such expenditure might be good or bad, in the long term, but the point here is that the balance sheet is not reflected by this ratio.
Tempur Sealy International's Balance Sheet
Tempur Sealy International's net debt equates to 36% of its market capitalization. While that's enough to warrant consideration, it doesn't really concern us.
The Verdict On Tempur Sealy International's P/E Ratio
Tempur Sealy International trades on a P/E ratio of 31.2, which is above its market average of 18.2. With some debt but no EPS growth last year, the market has high expectations of future profits.
Investors have an opportunity when market expectations about a stock are wrong. People often underestimate remarkable growth -- so investors can make money when fast growth is not fully appreciated. So this free report on the analyst consensus forecasts could help you make a master move on this stock.
You might be able to find a better buy than Tempur Sealy International. If you want a selection of possible winners, check out this free list of interesting companies that trade on a P/E below 20 (but have proven they can grow earnings).
We aim to bring you long-term focused research analysis driven by fundamental data. Note that our analysis may not factor in the latest price-sensitive company announcements or qualitative material.
If you spot an error that warrants correction, please contact the editor at editorial-team@simplywallst.com. This article by Simply Wall St is general in nature. It does not constitute a recommendation to buy or sell any stock, and does not take account of your objectives, or your financial situation. Simply Wall St has no position in the stocks mentioned. Thank you for reading.
