
 Yahoo Finance
 Should You Be Tempted To Sell Rhinebeck Bancorp, Inc. (NASDAQ:RBKB) Because Of Its P/E Ratio?

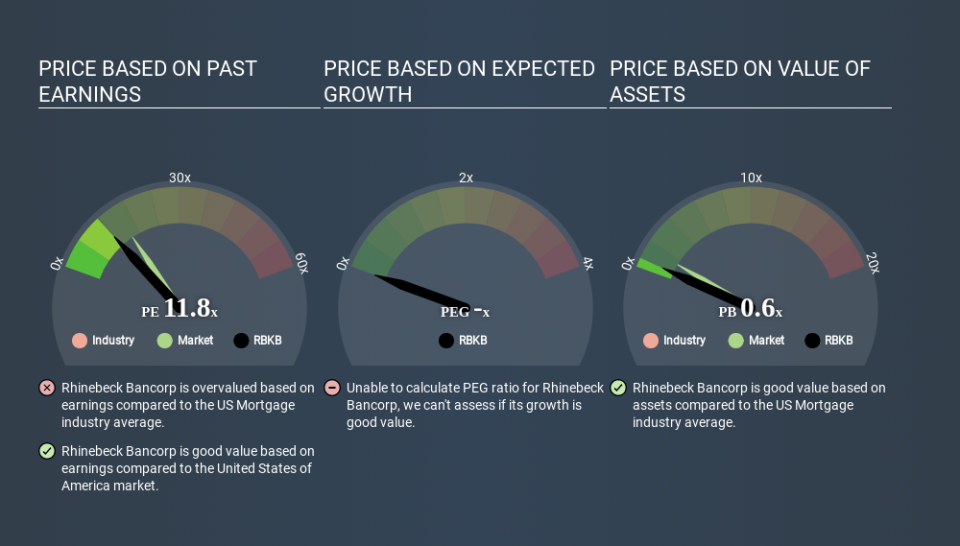
This article is written for those who want to get better at using price to earnings ratios (P/E ratios). We'll look at Rhinebeck Bancorp, Inc.'s (NASDAQ:RBKB) P/E ratio and reflect on what it tells us about the company's share price. Based on the last twelve months, Rhinebeck Bancorp's P/E ratio is 11.80. That corresponds to an earnings yield of approximately 8.5%.
View our latest analysis for Rhinebeck Bancorp
How Do I Calculate A Price To Earnings Ratio?
The formula for price to earnings is:
Price to Earnings Ratio = Share Price ÷ Earnings per Share (EPS)
Or for Rhinebeck Bancorp:
P/E of 11.80 = $6.750 ÷ $0.572 (Based on the trailing twelve months to March 2020.)
(Note: the above calculation results may not be precise due to rounding.)
Is A High Price-to-Earnings Ratio Good?
A higher P/E ratio means that investors are paying a higher price for each $1 of company earnings. That isn't necessarily good or bad, but a high P/E implies relatively high expectations of what a company can achieve in the future.
How Does Rhinebeck Bancorp's P/E Ratio Compare To Its Peers?
One good way to get a quick read on what market participants expect of a company is to look at its P/E ratio. As you can see below Rhinebeck Bancorp has a P/E ratio that is fairly close for the average for the mortgage industry, which is 11.1.
Its P/E ratio suggests that Rhinebeck Bancorp shareholders think that in the future it will perform about the same as other companies in its industry classification. So if Rhinebeck Bancorp actually outperforms its peers going forward, that should be a positive for the share price. Further research into factors such as insider buying and selling, could help you form your own view on whether that is likely.
How Growth Rates Impact P/E Ratios
Probably the most important factor in determining what P/E a company trades on is the earnings growth. If earnings are growing quickly, then the 'E' in the equation will increase faster than it would otherwise. That means even if the current P/E is high, it will reduce over time if the share price stays flat. Then, a lower P/E should attract more buyers, pushing the share price up.
It's nice to see that Rhinebeck Bancorp grew EPS by a stonking 31% in the last year.
Don't Forget: The P/E Does Not Account For Debt or Bank Deposits
Don't forget that the P/E ratio considers market capitalization. So it won't reflect the advantage of cash, or disadvantage of debt. The exact same company would hypothetically deserve a higher P/E ratio if it had a strong balance sheet, than if it had a weak one with lots of debt, because a cashed up company can spend on growth.
Spending on growth might be good or bad a few years later, but the point is that the P/E ratio does not account for the option (or lack thereof).
Is Debt Impacting Rhinebeck Bancorp's P/E?
Net debt totals 87% of Rhinebeck Bancorp's market cap. This is a reasonably significant level of debt -- all else being equal you'd expect a much lower P/E than if it had net cash.
The Verdict On Rhinebeck Bancorp's P/E Ratio
Rhinebeck Bancorp trades on a P/E ratio of 11.8, which is below the US market average of 15.6. The company may have significant debt, but EPS growth was good last year. If the company can continue to grow earnings, then the current P/E may be unjustifiably low.
Investors have an opportunity when market expectations about a stock are wrong. As value investor Benjamin Graham famously said, 'In the short run, the market is a voting machine but in the long run, it is a weighing machine. Although we don't have analyst forecasts you might want to assess this data-rich visualization of earnings, revenue and cash flow.
Of course you might be able to find a better stock than Rhinebeck Bancorp. So you may wish to see this free collection of other companies that have grown earnings strongly.
Love or hate this article? Concerned about the content? Get in touch with us directly. Alternatively, email editorial-team@simplywallst.com.
This article by Simply Wall St is general in nature. It does not constitute a recommendation to buy or sell any stock, and does not take account of your objectives, or your financial situation. We aim to bring you long-term focused analysis driven by fundamental data. Note that our analysis may not factor in the latest price-sensitive company announcements or qualitative material. Simply Wall St has no position in any stocks mentioned. Thank you for reading.
