
 Yahoo Finance
 Is Telstra Corporation Limited’s (ASX:TLS) P/E Ratio Really That Good?

Want to participate in a short research study? Help shape the future of investing tools and receive a $20 prize!
This article is written for those who want to get better at using price to earnings ratios (P/E ratios). We’ll look at Telstra Corporation Limited’s (ASX:TLS) P/E ratio and reflect on what it tells us about the company’s share price. Telstra has a price to earnings ratio of 12.5, based on the last twelve months. That is equivalent to an earnings yield of about 8.0%.
Check out our latest analysis for Telstra
How Do I Calculate Telstra’s Price To Earnings Ratio?
The formula for price to earnings is:
Price to Earnings Ratio = Price per Share ÷ Earnings per Share (EPS)
Or for Telstra:
P/E of 12.5 = A$3.25 ÷ A$0.26 (Based on the trailing twelve months to December 2018.)
Is A High P/E Ratio Good?
A higher P/E ratio means that investors are paying a higher price for each A$1 of company earnings. All else being equal, it’s better to pay a low price — but as Warren Buffett said, ‘It’s far better to buy a wonderful company at a fair price than a fair company at a wonderful price.’
How Growth Rates Impact P/E Ratios
If earnings fall then in the future the ‘E’ will be lower. Therefore, even if you pay a low multiple of earnings now, that multiple will become higher in the future. A higher P/E should indicate the stock is expensive relative to others — and that may encourage shareholders to sell.
Telstra shrunk earnings per share by 19% over the last year. And over the longer term (5 years) earnings per share have decreased 4.2% annually. This might lead to muted expectations.
How Does Telstra’s P/E Ratio Compare To Its Peers?
We can get an indication of market expectations by looking at the P/E ratio. The image below shows that Telstra has a lower P/E than the average (32.1) P/E for companies in the telecom industry.
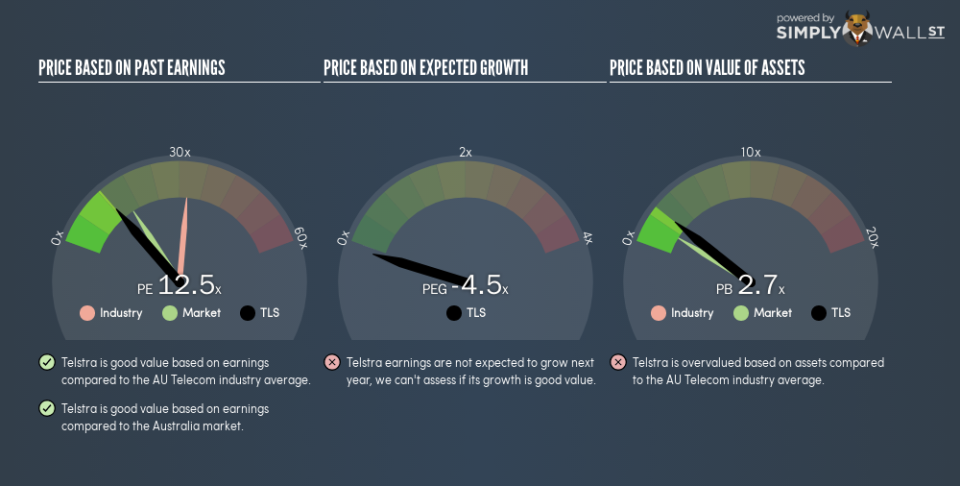
Its relatively low P/E ratio indicates that Telstra shareholders think it will struggle to do as well as other companies in its industry classification. Since the market seems unimpressed with Telstra, it’s quite possible it could surprise on the upside. It is arguably worth checking if insiders are buying shares, because that might imply they believe the stock is undervalued.
Remember: P/E Ratios Don’t Consider The Balance Sheet
The ‘Price’ in P/E reflects the market capitalization of the company. In other words, it does not consider any debt or cash that the company may have on the balance sheet. Hypothetically, a company could reduce its future P/E ratio by spending its cash (or taking on debt) to achieve higher earnings.
Such expenditure might be good or bad, in the long term, but the point here is that the balance sheet is not reflected by this ratio.
Telstra’s Balance Sheet
Telstra’s net debt is 47% of its market cap. This is enough debt that you’d have to make some adjustments before using the P/E ratio to compare it to a company with net cash.
The Verdict On Telstra’s P/E Ratio
Telstra’s P/E is 12.5 which is below average (15.9) in the AU market. With only modest debt, it’s likely the lack of EPS growth at least partially explains the pessimism implied by the P/E ratio.
When the market is wrong about a stock, it gives savvy investors an opportunity. As value investor Benjamin Graham famously said, ‘In the short run, the market is a voting machine but in the long run, it is a weighing machine.’ So this free visual report on analyst forecasts could hold they key to an excellent investment decision.
Of course, you might find a fantastic investment by looking at a few good candidates. So take a peek at this free list of companies with modest (or no) debt, trading on a P/E below 20.
We aim to bring you long-term focused research analysis driven by fundamental data. Note that our analysis may not factor in the latest price-sensitive company announcements or qualitative material.
If you spot an error that warrants correction, please contact the editor at editorial-team@simplywallst.com. This article by Simply Wall St is general in nature. It does not constitute a recommendation to buy or sell any stock, and does not take account of your objectives, or your financial situation. Simply Wall St has no position in the stocks mentioned. On rare occasion, data errors may occur. Thank you for reading.
