
 Yahoo Finance
 Are Telstra Corporation Limited’s (ASX:TLS) Returns On Investment Worth Your While?

Today we are going to look at Telstra Corporation Limited (ASX:TLS) to see whether it might be an attractive investment prospect. In particular, we'll consider its Return On Capital Employed (ROCE), as that can give us insight into how profitably the company is able to employ capital in its business.
First, we'll go over how we calculate ROCE. Second, we'll look at its ROCE compared to similar companies. Finally, we'll look at how its current liabilities affect its ROCE.
What is Return On Capital Employed (ROCE)?
ROCE is a metric for evaluating how much pre-tax income (in percentage terms) a company earns on the capital invested in its business. In general, businesses with a higher ROCE are usually better quality. Overall, it is a valuable metric that has its flaws. Author Edwin Whiting says to be careful when comparing the ROCE of different businesses, since 'No two businesses are exactly alike.
How Do You Calculate Return On Capital Employed?
Analysts use this formula to calculate return on capital employed:
Return on Capital Employed = Earnings Before Interest and Tax (EBIT) ÷ (Total Assets - Current Liabilities)
Or for Telstra:
0.091 = AU$3.0b ÷ (AU$43b - AU$9.6b) (Based on the trailing twelve months to June 2019.)
So, Telstra has an ROCE of 9.1%.
Check out our latest analysis for Telstra
Does Telstra Have A Good ROCE?
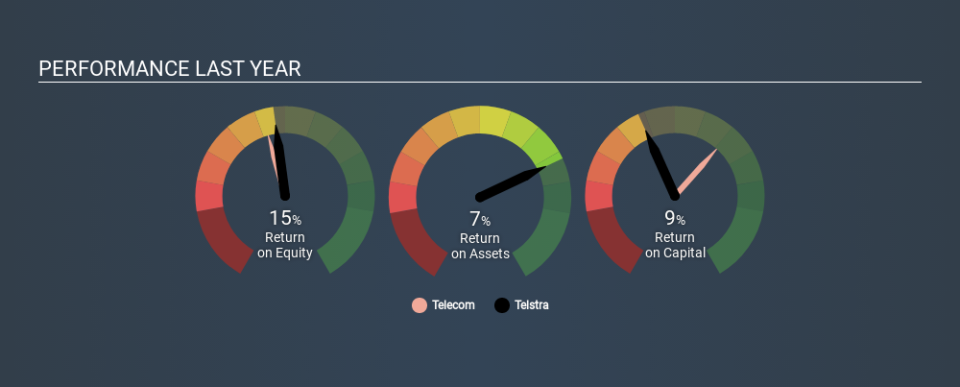
ROCE is commonly used for comparing the performance of similar businesses. Using our data, Telstra's ROCE appears to be around the 10% average of the Telecom industry. Independently of how Telstra compares to its industry, its ROCE in absolute terms appears decent, and the company may be worthy of closer investigation.
Telstra's current ROCE of 9.1% is lower than its ROCE in the past, which was 17%, 3 years ago. Therefore we wonder if the company is facing new headwinds. You can see in the image below how Telstra's ROCE compares to its industry. Click to see more on past growth.
When considering this metric, keep in mind that it is backwards looking, and not necessarily predictive. ROCE can be deceptive for cyclical businesses, as returns can look incredible in boom times, and terribly low in downturns. ROCE is only a point-in-time measure. Since the future is so important for investors, you should check out our free report on analyst forecasts for Telstra.
Do Telstra's Current Liabilities Skew Its ROCE?
Current liabilities include invoices, such as supplier payments, short-term debt, or a tax bill, that need to be paid within 12 months. Due to the way ROCE is calculated, a high level of current liabilities makes a company look as though it has less capital employed, and thus can (sometimes unfairly) boost the ROCE. To counter this, investors can check if a company has high current liabilities relative to total assets.
Telstra has total liabilities of AU$9.6b and total assets of AU$43b. Therefore its current liabilities are equivalent to approximately 22% of its total assets. Current liabilities are minimal, limiting the impact on ROCE.
Our Take On Telstra's ROCE
This is good to see, and with a sound ROCE, Telstra could be worth a closer look. Telstra shapes up well under this analysis, but it is far from the only business delivering excellent numbers . You might also want to check this free collection of companies delivering excellent earnings growth.
If you are like me, then you will not want to miss this free list of growing companies that insiders are buying.
If you spot an error that warrants correction, please contact the editor at editorial-team@simplywallst.com. This article by Simply Wall St is general in nature. It does not constitute a recommendation to buy or sell any stock, and does not take account of your objectives, or your financial situation. Simply Wall St has no position in the stocks mentioned.
We aim to bring you long-term focused research analysis driven by fundamental data. Note that our analysis may not factor in the latest price-sensitive company announcements or qualitative material. Thank you for reading.
