
 Yahoo Finance
 Here's What Technology One Limited's (ASX:TNE) P/E Is Telling Us

Want to participate in a research study? Help shape the future of investing tools and earn a $60 gift card!
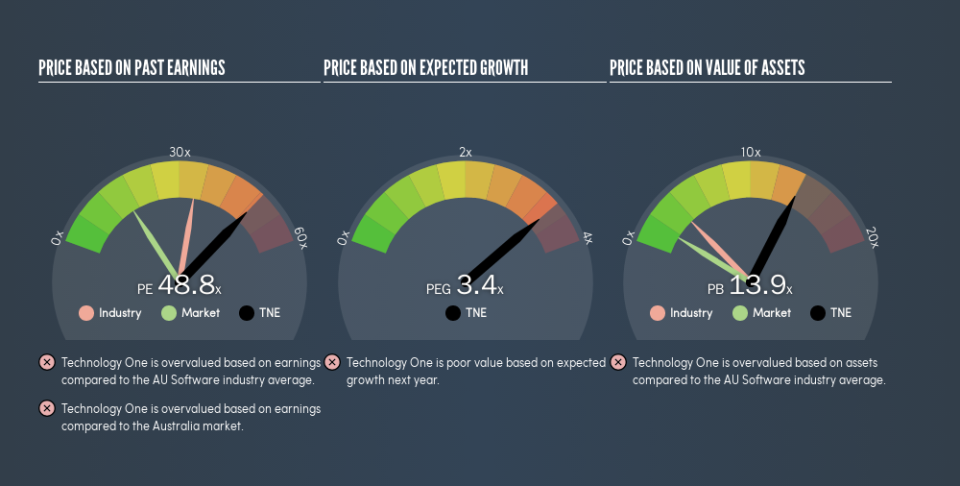
The goal of this article is to teach you how to use price to earnings ratios (P/E ratios). We'll look at Technology One Limited's (ASX:TNE) P/E ratio and reflect on what it tells us about the company's share price. Technology One has a P/E ratio of 48.75, based on the last twelve months. That means that at current prices, buyers pay A$48.75 for every A$1 in trailing yearly profits.
Check out our latest analysis for Technology One
How Do You Calculate A P/E Ratio?
The formula for price to earnings is:
Price to Earnings Ratio = Price per Share ÷ Earnings per Share (EPS)
Or for Technology One:
P/E of 48.75 = A$7.87 ÷ A$0.16 (Based on the trailing twelve months to September 2018.)
Is A High Price-to-Earnings Ratio Good?
A higher P/E ratio means that buyers have to pay a higher price for each A$1 the company has earned over the last year. All else being equal, it's better to pay a low price -- but as Warren Buffett said, 'It's far better to buy a wonderful company at a fair price than a fair company at a wonderful price.'
How Growth Rates Impact P/E Ratios
P/E ratios primarily reflect market expectations around earnings growth rates. When earnings grow, the 'E' increases, over time. Therefore, even if you pay a high multiple of earnings now, that multiple will become lower in the future. So while a stock may look expensive based on past earnings, it could be cheap based on future earnings.
It's great to see that Technology One grew EPS by 14% in the last year. And earnings per share have improved by 12% annually, over the last five years. This could arguably justify a relatively high P/E ratio.
How Does Technology One's P/E Ratio Compare To Its Peers?
The P/E ratio essentially measures market expectations of a company. As you can see below, Technology One has a higher P/E than the average company (34.1) in the software industry.
That means that the market expects Technology One will outperform other companies in its industry. The market is optimistic about the future, but that doesn't guarantee future growth. So further research is always essential. I often monitor director buying and selling.
Don't Forget: The P/E Does Not Account For Debt or Bank Deposits
The 'Price' in P/E reflects the market capitalization of the company. In other words, it does not consider any debt or cash that the company may have on the balance sheet. Theoretically, a business can improve its earnings (and produce a lower P/E in the future), by taking on debt (or spending its remaining cash).
Such expenditure might be good or bad, in the long term, but the point here is that the balance sheet is not reflected by this ratio.
How Does Technology One's Debt Impact Its P/E Ratio?
The extra options and safety that comes with Technology One's AU$104m net cash position means that it deserves a higher P/E than it would if it had a lot of net debt.
The Verdict On Technology One's P/E Ratio
Technology One has a P/E of 48.8. That's significantly higher than the average in the AU market, which is 16. Its net cash position supports a higher P/E ratio, as does its solid recent earnings growth. Therefore it seems reasonable that the market would have relatively high expectations of the company
Investors have an opportunity when market expectations about a stock are wrong. As value investor Benjamin Graham famously said, 'In the short run, the market is a voting machine but in the long run, it is a weighing machine.' So this free visualization of the analyst consensus on future earnings could help you make the right decision about whether to buy, sell, or hold.
You might be able to find a better buy than Technology One. If you want a selection of possible winners, check out this free list of interesting companies that trade on a P/E below 20 (but have proven they can grow earnings).
We aim to bring you long-term focused research analysis driven by fundamental data. Note that our analysis may not factor in the latest price-sensitive company announcements or qualitative material.
If you spot an error that warrants correction, please contact the editor at editorial-team@simplywallst.com. This article by Simply Wall St is general in nature. It does not constitute a recommendation to buy or sell any stock, and does not take account of your objectives, or your financial situation. Simply Wall St has no position in the stocks mentioned. Thank you for reading.
