
 Yahoo Finance
 Technical Update For US Equity Indices: 14.12.2018
Dow Jones Industrial Average [DJI30]
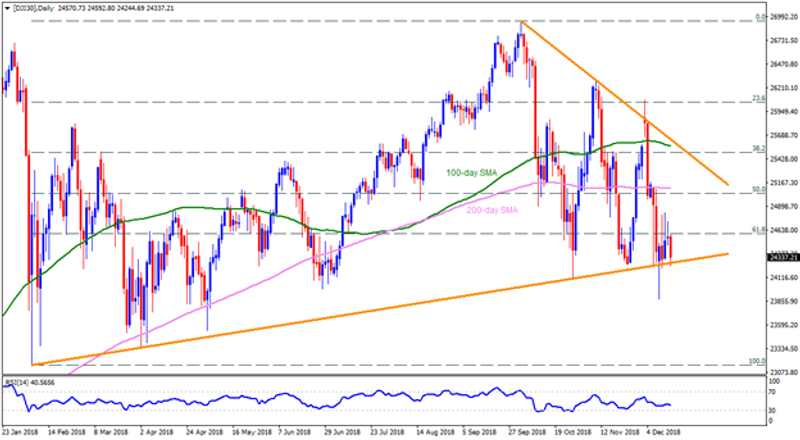
Repeated bounces off the ten-month old ascending support-line continue failing to rejuvenate Dow Jones’ strength as it re-tests the TL support figure of 24255 while writing the article, which in-turn portrays the gauge’s weakness. However, a daily closing under 24255 seems required to aim for 24100 and the 24000 rest-points. In case the quote keep declining past-24000, the 23800 and the 23500 are likely intermediate halts to watch ahead of witnessing 23145 on the chart. Alternatively, the 24700, the 24900 and the 200-day SMA level of 25100 may entertain counter-trend traders, breaking which 25570, comprising 100-day SMA, and the downward slanting resistance-line, at 25660, could gain market attention. Moreover, Bull’s ability to conquer 25660 can escalate the rally to 26000 and the 26200 resistance-levels.
S&P 500 [SP500]

Unlike DJI30, the SP500 has already broke one such support-line stretched since early February but has to close beneath the 2630 mark in order to flash 2600 and the 2580 on sellers’ radars. If at all Bears refrain to respect the 2580 level, the 2560, the 2530 and the 2500 may become their favorites. Meanwhile, a daily closing beyond 2630 can trigger the index recovery to 2700 and then to the 50-day SMA level of 2725. Should prices cross 2725 barrier, the 2750, the 2790 and the 2803, including 100-day SMA, might play their roles as resistances ahead of highlighting 1.2815-20 region as an upside hurdle.
Nasdaq [NQ100]

NQ100 has altogether different story than both the aforementioned indices as it still has some downside room, with the 6620, the 6570 and the 6500 stops, prior to challenging the 6445 support-line. Though, index slump beneath 6445 might not hesitate carving 6300 and the 6163 on chart. On the contrary, the 6860 and the 50-day SMA level of 6907, followed by an adjacent TL resistance at 7000, could question buyers’ strength before rewarding them with 7130 and the 100-day SMA level of 7200. It should also be noted that the index surge after 7200 can help target the 7390 and the 7480 if holding long positions.
This article was originally posted on FX Empire
