
 Yahoo Finance
 Technical Update For EUR/USD, GBP/USD, USD/JPY & AUD/USD: 17.10.2017
EUR/USD
With a month-old downward slanting trend-line again restricting the EURUSD’s upside, the pair is likely to re-test 1.1745 and the 1.1715-10 supports. Though, the 1.1685-80 horizontal-region might confine its following downside, if not then the pair could plunge in a direction to 1.1660 and then to the 61.8% FE level of 1.1620. On the upside, the 1.1790 and the 1.1830 could offer immediate resistances to the pair before it again confronts the 1.1860 TL mark. In case if the quote manages to surpass 1.1860, the 1.1920 and the 1.1955-60 could raise the barriers during its north-run target 1.2000 psychological magnets.
GBP/USD
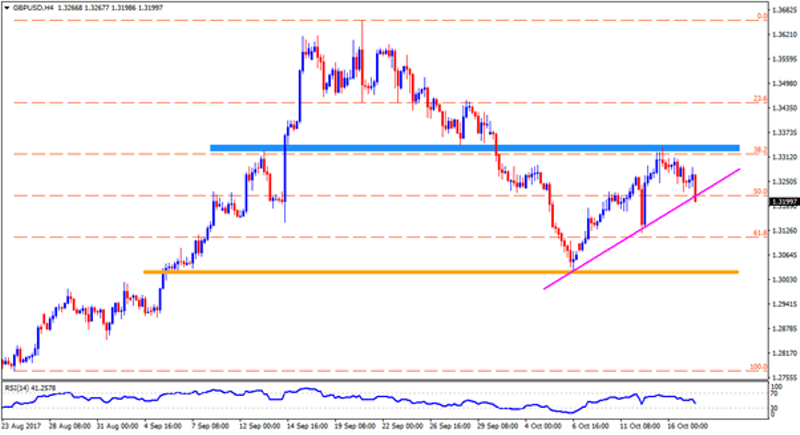
Even if the 1.3330-40 horizontal-area triggered GBPUSD’s pullback, a short-term ascending trend-line, at 1.3210 now, keeps favoring the pair’s advances, break of which can drag it to 1.3160 and then to the 1.3100 while 1.3020-30 may become a strong support to observe afterward. Should prices decline beneath 1.3020, the 1.3000 round-figure becomes a buffer to clear in order for them to meet 1.2910 rest-point. Meanwhile, pair’s successful break above 1.3340 could help accelerate its recovery towards 1.3410 and then to the 1.3465-70. Moreover, Bulls’ refrain to respect the 1.3470 may reflect their focus on 1.3580 and the 1.3610 resistances.
USD/JPY
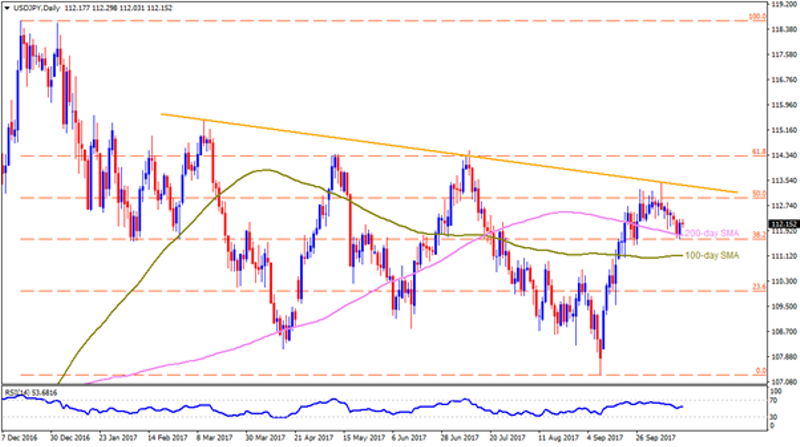
USDJPY’s latest bounce from 200-day SMA presently confronts with 112.30 resistance-mark, breaking which it can rise to 112.80 and then to the seven-month-long descending trend-line number of 113.40. Given the pair’s break of 113.40 on D1 basis, the 113.85 and the 114.35 might please buyers. Alternatively, a daily close below the said SMA figure of 111.75 can have 111.30 and the 111.10, comprising 100-day SMA, as follow-on supports prior to its drop towards 111.00 and then to the 110.65. During the pair’s additional south-run below 110.65, the 109.50 and the 108.70 can entertain the Bears.
AUD/USD

While 0.7900–0.7910 played its role it confining the AUDUSD’s recovery during late last-week, pair’s recent U-turn from 0.7830 is likely helping the quote to challenge the said resistance-zone again. In case if prices surpass 0.7910, the 0.7940 and the 0.7975 trend-line gains market attention, which if broken could further strengthen the upside momentum in aiming the 0.8030-35 north-side area. During the course of pair’s decline, the 0.7830 and the 0.7815 trend-line support can act as immediate supports, breaking which can drag it to 0.7780 and then to 0.7740 numbers. If at all selling pressure continue remaining present after 0.7740, the 61.8% FE level of 0.7665 may appear on the chart.
Cheers and Safe Trading,
Anil Panchal
This article was originally posted on FX Empire
