
 Yahoo Finance
 Technical Update For EUR/USD, GBP/USD, USD/JPY & NZD/USD: 24.04.2018
EUR/USD
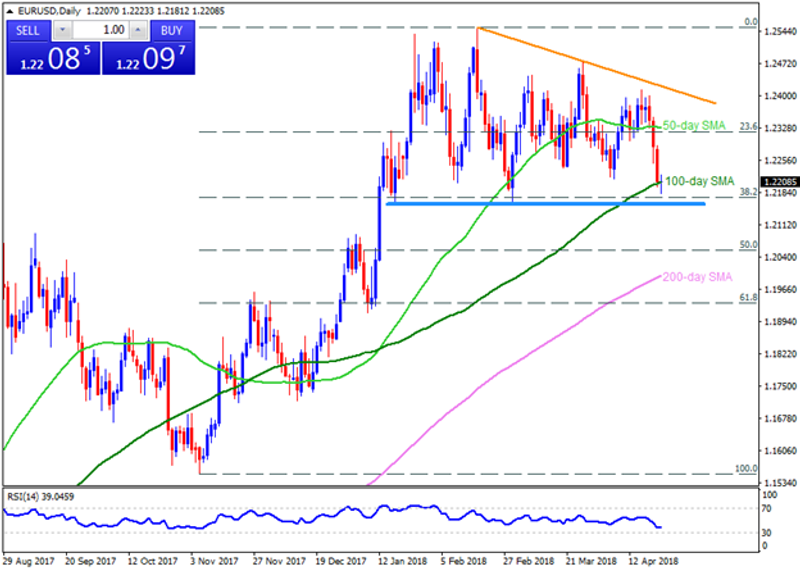
Even after printing the lowest levels in more than seven-weeks, the EURUSD is struggling with 100-day SMA, at 1.2210 now, in order to revisit the 1.2165-55 horizontal-support. Should the pair fails to register a daily closing below 1.2210, it can bounce-back to the 1.2240 and then to the 1.2275-80 resistances. In case if the recovery stretches beyond 1.2280, the 1.2300 and the 50-day SMA level of 1.2330 could challenge the buyers ahead of fueling the pair towards 1.2400 mark. Given the pair’s D1 close below 1.2210, followed by the 1.2155 clearance, it can slump to the 1.2090 and the 1.2030 before taking rest on 200-day SMA level of 1.2000 psychological magnet.
GBP/USD

Contrary to EURUSD, the GBPUSD has already broke near-term important support and is more likely to test the 1.3910 support prior to availing the 1.3850 figure, comprising 100-day SMA; though, oversold RSI can play its role around then, failing to which could fetch the quote to the 1.3790 and the 1.3715 supports. On the contrary, the support-turned-resistance line, near 1.4010, next to the 50-day SMA level of 1.4020, can keep limiting the pair’s immediate upside, breaking which 1.4100 and the 1.4145 may gain traders’ attention. Assuming Bulls’ dominance over the momentum after 1.4145, the 1.4160 and the 1.4230 could prove their presence on the chart.
USD/JPY

While successful break of 107.90 propelled the USDJPY to early-February highs, 100-day SMA level of 109.00 seems crucial for the pair right now, which if surpassed could extend the present rally in direction to 109.40 and the 109.80 resistances but 110.20-30 area, including 200-day SMA might confine the pair’s following north-run. Let’s say the optimists conquer 110.30 number, they can confront the downward slanting TL stretched since November around 110.90. Meanwhile, 108.40 and the 107.90 might offer adjacent supports to the pair if it reverses from current levels, breaking them can highlight the 107.40 and the 107.00 as quotes. Additionally, pair’s further downside beneath the 107.00 may push sellers to aim for 50-day SMA level of 106.60 and the 106.00 levels.
NZD/USD

Having clearly breached the 0.7155-50 horizontal-region, the NZDUSD needs to dip below the 0.7100 if it is to re-test the 0.7055 and the 0.7035-30 support-zone. During the pair’s extra declines beneath the 0.7030, the 0.7000 round-figure and the 0.6970 may please the Bears. Alternatively, a D1 close above 0.7155 can rejuvenate the pair’s strength to target the 200-day SMA level of 0.7185 and the 0.7215 mark, encompassing 100-day SMA. In case of the pair’s sustained rise above 0.7215, the 0.7260 and the 50-day SMA level of 0.7285 might show the NZD’s strength.
Cheers and Safe Trading,
Anil Panchal
This article was originally posted on FX Empire
