
 Yahoo Finance
 What Is TD Ameritrade Holding's (NASDAQ:AMTD) P/E Ratio After Its Share Price Rocketed?

TD Ameritrade Holding (NASDAQ:AMTD) shares have had a really impressive month, gaining 34%, after some slippage. The bad news is that even after that recovery shareholders are still underwater by about 2.4% for the full year.
All else being equal, a sharp share price increase should make a stock less attractive to potential investors. While the market sentiment towards a stock is very changeable, in the long run, the share price will tend to move in the same direction as earnings per share. So some would prefer to hold off buying when there is a lot of optimism towards a stock. Perhaps the simplest way to get a read on investors' expectations of a business is to look at its Price to Earnings Ratio (PE Ratio). A high P/E ratio means that investors have a high expectation about future growth, while a low P/E ratio means they have low expectations about future growth.
Check out our latest analysis for TD Ameritrade Holding
How Does TD Ameritrade Holding's P/E Ratio Compare To Its Peers?
TD Ameritrade Holding's P/E of 13.02 indicates relatively low sentiment towards the stock. We can see in the image below that the average P/E (32.7) for companies in the capital markets industry is higher than TD Ameritrade Holding's P/E.
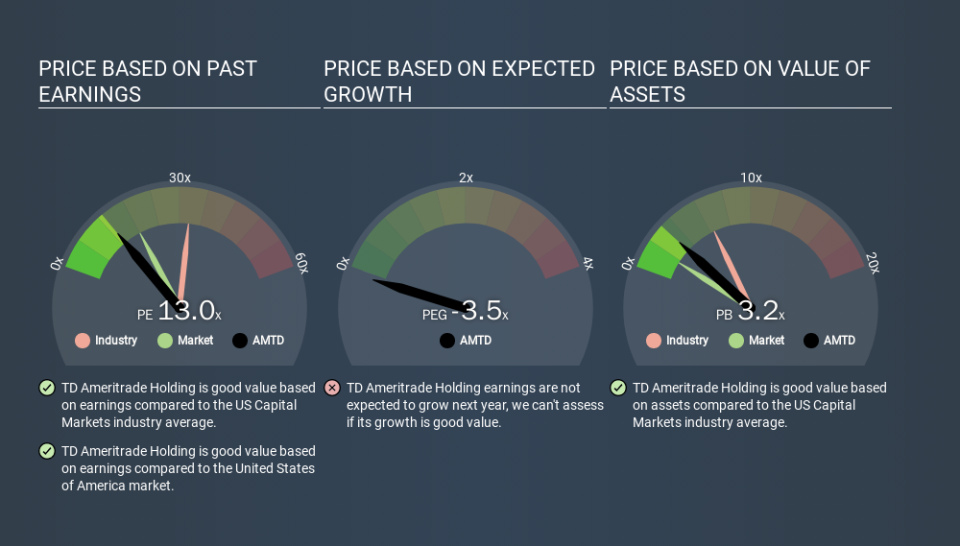
TD Ameritrade Holding's P/E tells us that market participants think it will not fare as well as its peers in the same industry. Since the market seems unimpressed with TD Ameritrade Holding, it's quite possible it could surprise on the upside. If you consider the stock interesting, further research is recommended. For example, I often monitor director buying and selling.
How Growth Rates Impact P/E Ratios
P/E ratios primarily reflect market expectations around earnings growth rates. That's because companies that grow earnings per share quickly will rapidly increase the 'E' in the equation. That means even if the current P/E is high, it will reduce over time if the share price stays flat. So while a stock may look expensive based on past earnings, it could be cheap based on future earnings.
TD Ameritrade Holding's 53% EPS improvement over the last year was like bamboo growth after rain; rapid and impressive. The cherry on top is that the five year growth rate was an impressive 23% per year. So I'd be surprised if the P/E ratio was not above average.
Don't Forget: The P/E Does Not Account For Debt or Bank Deposits
The 'Price' in P/E reflects the market capitalization of the company. That means it doesn't take debt or cash into account. In theory, a company can lower its future P/E ratio by using cash or debt to invest in growth.
Such expenditure might be good or bad, in the long term, but the point here is that the balance sheet is not reflected by this ratio.
TD Ameritrade Holding's Balance Sheet
With net cash of US$8.5b, TD Ameritrade Holding has a very strong balance sheet, which may be important for its business. Having said that, at 30% of its market capitalization the cash hoard would contribute towards a higher P/E ratio.
The Bottom Line On TD Ameritrade Holding's P/E Ratio
TD Ameritrade Holding has a P/E of 13.0. That's below the average in the US market, which is 18.3. The net cash position gives plenty of options to the business, and the recent improvement in EPS is good to see. The below average P/E ratio suggests that market participants don't believe the strong growth will continue. What we know for sure is that investors have become more excited about TD Ameritrade Holding recently, since they have pushed its P/E ratio from 9.7 to 13.0 over the last month. If you like to buy stocks that have recently impressed the market, then this one might be a candidate; but if you prefer to invest when there is 'blood in the streets', then you may feel the opportunity has passed.
When the market is wrong about a stock, it gives savvy investors an opportunity. As value investor Benjamin Graham famously said, 'In the short run, the market is a voting machine but in the long run, it is a weighing machine. So this free visualization of the analyst consensus on future earnings could help you make the right decision about whether to buy, sell, or hold.
Of course, you might find a fantastic investment by looking at a few good candidates. So take a peek at this free list of companies with modest (or no) debt, trading on a P/E below 20.
If you spot an error that warrants correction, please contact the editor at editorial-team@simplywallst.com. This article by Simply Wall St is general in nature. It does not constitute a recommendation to buy or sell any stock, and does not take account of your objectives, or your financial situation. Simply Wall St has no position in the stocks mentioned.
We aim to bring you long-term focused research analysis driven by fundamental data. Note that our analysis may not factor in the latest price-sensitive company announcements or qualitative material. Thank you for reading.
