
 Yahoo Finance
 Tamawood Limited (ASX:TWD) Stock Is Going Strong But Fundamentals Look Uncertain: What Lies Ahead ?
Tamawood (ASX:TWD) has had a great run on the share market with its stock up by a significant 17% over the last three months. However, we wonder if the company's inconsistent financials would have any adverse impact on the current share price momentum. Particularly, we will be paying attention to Tamawood's ROE today.
Return on equity or ROE is a key measure used to assess how efficiently a company's management is utilizing the company's capital. Simply put, it is used to assess the profitability of a company in relation to its equity capital.
Check out our latest analysis for Tamawood
How Do You Calculate Return On Equity?
Return on equity can be calculated by using the formula:
Return on Equity = Net Profit (from continuing operations) ÷ Shareholders' Equity
So, based on the above formula, the ROE for Tamawood is:
14% = AU$4.5m ÷ AU$33m (Based on the trailing twelve months to December 2023).
The 'return' refers to a company's earnings over the last year. That means that for every A$1 worth of shareholders' equity, the company generated A$0.14 in profit.
What Has ROE Got To Do With Earnings Growth?
We have already established that ROE serves as an efficient profit-generating gauge for a company's future earnings. We now need to evaluate how much profit the company reinvests or "retains" for future growth which then gives us an idea about the growth potential of the company. Generally speaking, other things being equal, firms with a high return on equity and profit retention, have a higher growth rate than firms that don’t share these attributes.
A Side By Side comparison of Tamawood's Earnings Growth And 14% ROE
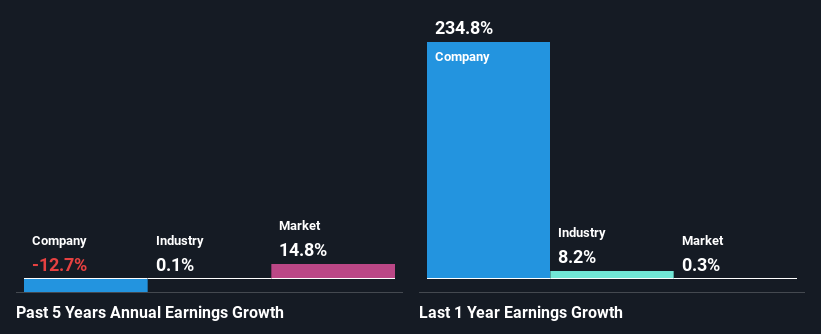
To start with, Tamawood's ROE looks acceptable. And on comparing with the industry, we found that the the average industry ROE is similar at 14%. As you might expect, the 13% net income decline reported by Tamawood is a bit of a surprise. So, there might be some other aspects that could explain this. For example, it could be that the company has a high payout ratio or the business has allocated capital poorly, for instance.
So, as a next step, we compared Tamawood's performance against the industry and were disappointed to discover that while the company has been shrinking its earnings, the industry has been growing its earnings at a rate of 0.1% over the last few years.
Earnings growth is an important metric to consider when valuing a stock. It’s important for an investor to know whether the market has priced in the company's expected earnings growth (or decline). Doing so will help them establish if the stock's future looks promising or ominous. If you're wondering about Tamawood's's valuation, check out this gauge of its price-to-earnings ratio, as compared to its industry.
Is Tamawood Using Its Retained Earnings Effectively?
With a three-year median payout ratio as high as 133%,Tamawood's shrinking earnings don't come as a surprise as the company is paying a dividend which is beyond its means. Paying a dividend beyond their means is usually not viable over the long term. You can see the 4 risks we have identified for Tamawood by visiting our risks dashboard for free on our platform here.
In addition, Tamawood has been paying dividends over a period of at least ten years suggesting that keeping up dividend payments is way more important to the management even if it comes at the cost of business growth.
Conclusion
On the whole, we feel that the performance shown by Tamawood can be open to many interpretations. In spite of the high ROE, the company has failed to see growth in its earnings due to it paying out most of its profits as dividend, with almost nothing left to invest into its own business. So far, we've only made a quick discussion around the company's earnings growth. To gain further insights into Tamawood's past profit growth, check out this visualization of past earnings, revenue and cash flows.
Have feedback on this article? Concerned about the content? Get in touch with us directly. Alternatively, email editorial-team (at) simplywallst.com.
This article by Simply Wall St is general in nature. We provide commentary based on historical data and analyst forecasts only using an unbiased methodology and our articles are not intended to be financial advice. It does not constitute a recommendation to buy or sell any stock, and does not take account of your objectives, or your financial situation. We aim to bring you long-term focused analysis driven by fundamental data. Note that our analysis may not factor in the latest price-sensitive company announcements or qualitative material. Simply Wall St has no position in any stocks mentioned.
