
 Yahoo Finance
 TAKKT's (ETR:TTK) investors will be pleased with their 25% return over the last five years
These days it's easy to simply buy an index fund, and your returns should (roughly) match the market. But even in a market-beating portfolio, some stocks will lag the market. While the TAKKT AG (ETR:TTK) share price is down 17% over half a decade, the total return to shareholders (which includes dividends) was 25%. That's better than the market which declined 19% over the same time.
So let's have a look and see if the longer term performance of the company has been in line with the underlying business' progress.
Check out our latest analysis for TAKKT
There is no denying that markets are sometimes efficient, but prices do not always reflect underlying business performance. By comparing earnings per share (EPS) and share price changes over time, we can get a feel for how investor attitudes to a company have morphed over time.
Looking back five years, both TAKKT's share price and EPS declined; the latter at a rate of 22% per year. This fall in the EPS is worse than the 4% compound annual share price fall. The relatively muted share price reaction might be because the market expects the business to turn around.
You can see how EPS has changed over time in the image below (click on the chart to see the exact values).
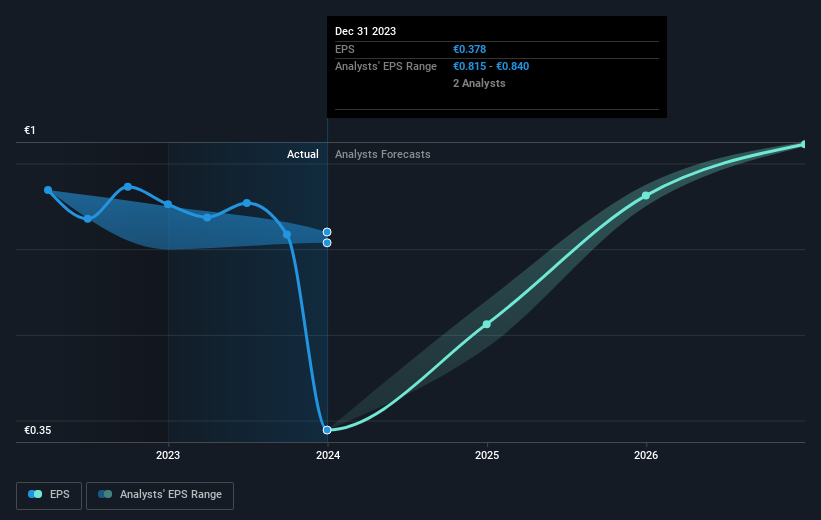
Dive deeper into TAKKT's key metrics by checking this interactive graph of TAKKT's earnings, revenue and cash flow.
What About Dividends?
When looking at investment returns, it is important to consider the difference between total shareholder return (TSR) and share price return. The TSR is a return calculation that accounts for the value of cash dividends (assuming that any dividend received was reinvested) and the calculated value of any discounted capital raisings and spin-offs. So for companies that pay a generous dividend, the TSR is often a lot higher than the share price return. As it happens, TAKKT's TSR for the last 5 years was 25%, which exceeds the share price return mentioned earlier. And there's no prize for guessing that the dividend payments largely explain the divergence!
A Different Perspective
TAKKT shareholders are down 3.5% for the year (even including dividends), but the market itself is up 4.9%. Even the share prices of good stocks drop sometimes, but we want to see improvements in the fundamental metrics of a business, before getting too interested. On the bright side, long term shareholders have made money, with a gain of 5% per year over half a decade. It could be that the recent sell-off is an opportunity, so it may be worth checking the fundamental data for signs of a long term growth trend. It's always interesting to track share price performance over the longer term. But to understand TAKKT better, we need to consider many other factors. Take risks, for example - TAKKT has 3 warning signs we think you should be aware of.
But note: TAKKT may not be the best stock to buy. So take a peek at this free list of interesting companies with past earnings growth (and further growth forecast).
Please note, the market returns quoted in this article reflect the market weighted average returns of stocks that currently trade on German exchanges.
Have feedback on this article? Concerned about the content? Get in touch with us directly. Alternatively, email editorial-team (at) simplywallst.com.
This article by Simply Wall St is general in nature. We provide commentary based on historical data and analyst forecasts only using an unbiased methodology and our articles are not intended to be financial advice. It does not constitute a recommendation to buy or sell any stock, and does not take account of your objectives, or your financial situation. We aim to bring you long-term focused analysis driven by fundamental data. Note that our analysis may not factor in the latest price-sensitive company announcements or qualitative material. Simply Wall St has no position in any stocks mentioned.
