
 Yahoo Finance
 How Do Tabcorp Holdings Limited’s (ASX:TAH) Returns On Capital Compare To Peers?

Today we'll look at Tabcorp Holdings Limited (ASX:TAH) and reflect on its potential as an investment. Specifically, we're going to calculate its Return On Capital Employed (ROCE), in the hopes of getting some insight into the business.
First up, we'll look at what ROCE is and how we calculate it. Second, we'll look at its ROCE compared to similar companies. Finally, we'll look at how its current liabilities affect its ROCE.
Understanding Return On Capital Employed (ROCE)
ROCE measures the 'return' (pre-tax profit) a company generates from capital employed in its business. Generally speaking a higher ROCE is better. Ultimately, it is a useful but imperfect metric. Author Edwin Whiting says to be careful when comparing the ROCE of different businesses, since 'No two businesses are exactly alike.'
How Do You Calculate Return On Capital Employed?
The formula for calculating the return on capital employed is:
Return on Capital Employed = Earnings Before Interest and Tax (EBIT) ÷ (Total Assets - Current Liabilities)
Or for Tabcorp Holdings:
0.046 = AU$538m ÷ (AU$13b - AU$1.5b) (Based on the trailing twelve months to December 2018.)
So, Tabcorp Holdings has an ROCE of 4.6%.
Check out our latest analysis for Tabcorp Holdings
Does Tabcorp Holdings Have A Good ROCE?
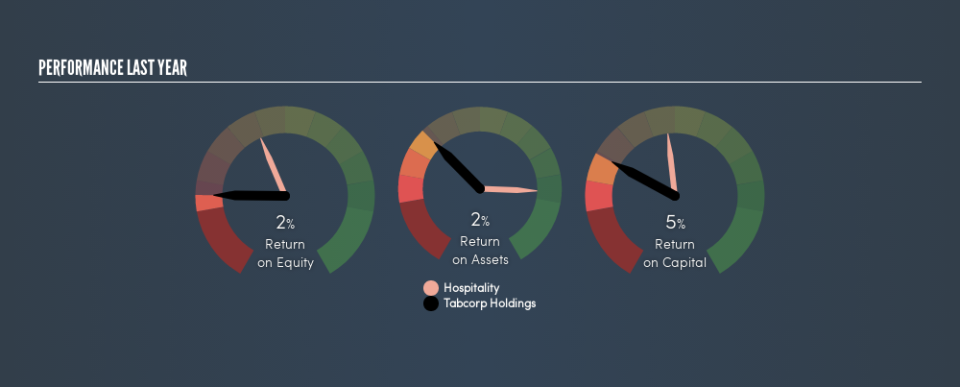
When making comparisons between similar businesses, investors may find ROCE useful. We can see Tabcorp Holdings's ROCE is meaningfully below the Hospitality industry average of 11%. This performance is not ideal, as it suggests the company may not be deploying its capital as effectively as some competitors. Regardless of how Tabcorp Holdings stacks up against its industry, its ROCE in absolute terms is quite low (especially compared to a bank account). There are potentially more appealing investments elsewhere.
Tabcorp Holdings's current ROCE of 4.6% is lower than 3 years ago, when the company reported a 11% ROCE. So investors might consider if it has had issues recently. You can see in the image below how Tabcorp Holdings's ROCE compares to its industry. Click to see more on past growth.
When considering this metric, keep in mind that it is backwards looking, and not necessarily predictive. ROCE can be deceptive for cyclical businesses, as returns can look incredible in boom times, and terribly low in downturns. ROCE is only a point-in-time measure. What happens in the future is pretty important for investors, so we have prepared a free report on analyst forecasts for Tabcorp Holdings.
What Are Current Liabilities, And How Do They Affect Tabcorp Holdings's ROCE?
Liabilities, such as supplier bills and bank overdrafts, are referred to as current liabilities if they need to be paid within 12 months. Due to the way ROCE is calculated, a high level of current liabilities makes a company look as though it has less capital employed, and thus can (sometimes unfairly) boost the ROCE. To counteract this, we check if a company has high current liabilities, relative to its total assets.
Tabcorp Holdings has total liabilities of AU$1.5b and total assets of AU$13b. As a result, its current liabilities are equal to approximately 11% of its total assets. This is a modest level of current liabilities, which will have a limited impact on the ROCE.
The Bottom Line On Tabcorp Holdings's ROCE
While that is good to see, Tabcorp Holdings has a low ROCE and does not look attractive in this analysis. Of course, you might also be able to find a better stock than Tabcorp Holdings. So you may wish to see this free collection of other companies that have grown earnings strongly.
If you are like me, then you will not want to miss this free list of growing companies that insiders are buying.
We aim to bring you long-term focused research analysis driven by fundamental data. Note that our analysis may not factor in the latest price-sensitive company announcements or qualitative material.
If you spot an error that warrants correction, please contact the editor at editorial-team@simplywallst.com. This article by Simply Wall St is general in nature. It does not constitute a recommendation to buy or sell any stock, and does not take account of your objectives, or your financial situation. Simply Wall St has no position in the stocks mentioned. Thank you for reading.
