
 Yahoo Finance
 Do You Like SYNNEX Corporation (NYSE:SNX) At This P/E Ratio?

Today, we'll introduce the concept of the P/E ratio for those who are learning about investing. We'll show how you can use SYNNEX Corporation's (NYSE:SNX) P/E ratio to inform your assessment of the investment opportunity. Based on the last twelve months, SYNNEX's P/E ratio is 10.89. That is equivalent to an earnings yield of about 9.2%.
Check out our latest analysis for SYNNEX
How Do You Calculate A P/E Ratio?
The formula for price to earnings is:
Price to Earnings Ratio = Share Price ÷ Earnings per Share (EPS)
Or for SYNNEX:
P/E of 10.89 = $106.650 ÷ $9.791 (Based on the trailing twelve months to November 2019.)
(Note: the above calculation results may not be precise due to rounding.)
Is A High Price-to-Earnings Ratio Good?
The higher the P/E ratio, the higher the price tag of a business, relative to its trailing earnings. That isn't necessarily good or bad, but a high P/E implies relatively high expectations of what a company can achieve in the future.
How Does SYNNEX's P/E Ratio Compare To Its Peers?
We can get an indication of market expectations by looking at the P/E ratio. The image below shows that SYNNEX has a lower P/E than the average (15.7) P/E for companies in the electronic industry.
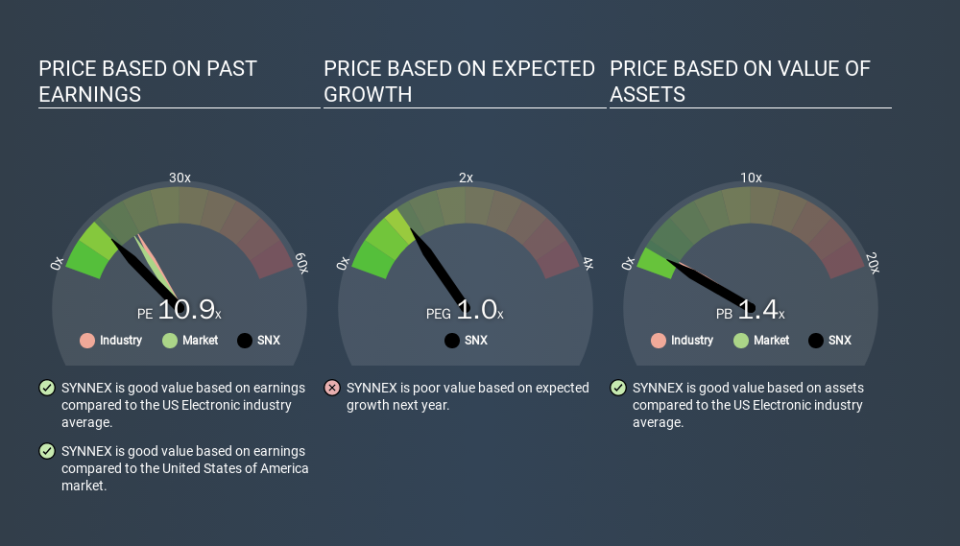
Its relatively low P/E ratio indicates that SYNNEX shareholders think it will struggle to do as well as other companies in its industry classification. Many investors like to buy stocks when the market is pessimistic about their prospects. It is arguably worth checking if insiders are buying shares, because that might imply they believe the stock is undervalued.
How Growth Rates Impact P/E Ratios
Probably the most important factor in determining what P/E a company trades on is the earnings growth. That's because companies that grow earnings per share quickly will rapidly increase the 'E' in the equation. That means even if the current P/E is high, it will reduce over time if the share price stays flat. So while a stock may look expensive based on past earnings, it could be cheap based on future earnings.
SYNNEX increased earnings per share by a whopping 36% last year. And it has bolstered its earnings per share by 16% per year over the last five years. I'd therefore be a little surprised if its P/E ratio was not relatively high.
A Limitation: P/E Ratios Ignore Debt and Cash In The Bank
Don't forget that the P/E ratio considers market capitalization. That means it doesn't take debt or cash into account. Hypothetically, a company could reduce its future P/E ratio by spending its cash (or taking on debt) to achieve higher earnings.
Such spending might be good or bad, overall, but the key point here is that you need to look at debt to understand the P/E ratio in context.
So What Does SYNNEX's Balance Sheet Tell Us?
Net debt totals 51% of SYNNEX's market cap. This is enough debt that you'd have to make some adjustments before using the P/E ratio to compare it to a company with net cash.
The Verdict On SYNNEX's P/E Ratio
SYNNEX has a P/E of 10.9. That's below the average in the US market, which is 15.1. The company may have significant debt, but EPS growth was good last year. If it continues to grow, then the current low P/E may prove to be unjustified.
Investors have an opportunity when market expectations about a stock are wrong. If it is underestimating a company, investors can make money by buying and holding the shares until the market corrects itself. So this free report on the analyst consensus forecasts could help you make a master move on this stock.
You might be able to find a better buy than SYNNEX. If you want a selection of possible winners, check out this free list of interesting companies that trade on a P/E below 20 (but have proven they can grow earnings).
If you spot an error that warrants correction, please contact the editor at editorial-team@simplywallst.com. This article by Simply Wall St is general in nature. It does not constitute a recommendation to buy or sell any stock, and does not take account of your objectives, or your financial situation. Simply Wall St has no position in the stocks mentioned.
We aim to bring you long-term focused research analysis driven by fundamental data. Note that our analysis may not factor in the latest price-sensitive company announcements or qualitative material. Thank you for reading.
