
 Yahoo Finance
 Sydney Airport's (ASX:SYD) Shareholders Are Down 22% On Their Shares
As an investor its worth striving to ensure your overall portfolio beats the market average. But the risk of stock picking is that you will likely buy under-performing companies. Unfortunately, that's been the case for longer term Sydney Airport Limited (ASX:SYD) shareholders, since the share price is down 22% in the last three years, falling well short of the market return of around 34%. There was little comfort for shareholders in the last week as the price declined a further 2.6%.
Check out our latest analysis for Sydney Airport
While markets are a powerful pricing mechanism, share prices reflect investor sentiment, not just underlying business performance. One way to examine how market sentiment has changed over time is to look at the interaction between a company's share price and its earnings per share (EPS).
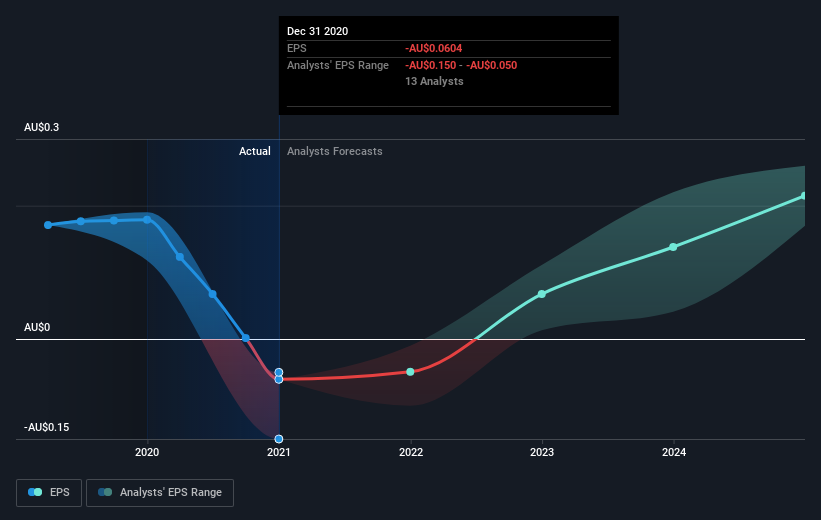
Over the three years that the share price declined, Sydney Airport's earnings per share (EPS) dropped significantly, falling to a loss. Since the company has fallen to a loss making position, it's hard to compare the change in EPS with the share price change. However, we can say we'd expect to see a falling share price in this scenario.
You can see below how EPS has changed over time (discover the exact values by clicking on the image).
We consider it positive that insiders have made significant purchases in the last year. Having said that, most people consider earnings and revenue growth trends to be a more meaningful guide to the business. Dive deeper into the earnings by checking this interactive graph of Sydney Airport's earnings, revenue and cash flow.
What about the Total Shareholder Return (TSR)?
Investors should note that there's a difference between Sydney Airport's total shareholder return (TSR) and its share price change, which we've covered above. The TSR is a return calculation that accounts for the value of cash dividends (assuming that any dividend received was reinvested) and the calculated value of any discounted capital raisings and spin-offs. Dividends have been really beneficial for Sydney Airport shareholders, and that cash payout explains why its total shareholder loss of 11%, over the last 3 years, isn't as bad as the share price return.
A Different Perspective
Sydney Airport shareholders are up 1.9% for the year. But that return falls short of the market. On the bright side, that's still a gain, and it's actually better than the average return of 1.0% over half a decade It is possible that returns will improve along with the business fundamentals. I find it very interesting to look at share price over the long term as a proxy for business performance. But to truly gain insight, we need to consider other information, too. To that end, you should learn about the 2 warning signs we've spotted with Sydney Airport (including 1 which is concerning) .
If you like to buy stocks alongside management, then you might just love this free list of companies. (Hint: insiders have been buying them).
Please note, the market returns quoted in this article reflect the market weighted average returns of stocks that currently trade on AU exchanges.
This article by Simply Wall St is general in nature. It does not constitute a recommendation to buy or sell any stock, and does not take account of your objectives, or your financial situation. We aim to bring you long-term focused analysis driven by fundamental data. Note that our analysis may not factor in the latest price-sensitive company announcements or qualitative material. Simply Wall St has no position in any stocks mentioned.
Have feedback on this article? Concerned about the content? Get in touch with us directly. Alternatively, email editorial-team (at) simplywallst.com.
