
 Yahoo Finance
 Is SVB Financial (SIVB) A Good Pick for Value Investors?
Value investing is easily one of the most popular ways to find great stocks in any market environment. After all, who wouldn’t want to find stocks that are either flying under the radar and are compelling buys, or offer up tantalizing discounts when compared to fair value?
One way to find these companies is by looking at several key metrics and financial ratios, many of which are crucial in the value stock selection process. Let’s put SVB Financial Group SIVB stock into this equation and find out if it is a good choice for value-oriented investors right now, or if investors subscribing to this methodology should look elsewhere for top picks:
PE Ratio
A key metric that value investors always look at is the Price to Earnings Ratio, or PE for short. This shows us how much investors are willing to pay for each dollar of earnings in a given stock, and is easily one of the most popular financial ratios in the world. The best use of the PE ratio is to compare the stock’s current PE ratio with: a) where this ratio has been in the past; b) how it compares to the average for the industry/sector; and c) how it compares to the market as a whole.
On this front, SVB Financial has a trailing twelve months PE ratio of 10.72, as you can see in the chart below:

This level actually compares pretty favorably with the market at large, as the PE for the S&P 500 compares in at about 19.18. If we focus on the stock’s long-term PE trend, the current level puts SVB Financial’s current PE ratio noticeably below its midpoint (which is 20.60) over the past five years.

Further, the stock’s PE compares favorably with the Zacks Finance sector’s trailing twelve months PE ratio, which stands at 13.98. At the very least, this indicates that the stock is relatively undervalued right now, compared to its peers.

We should also point out that SVB Financial has a forward PE ratio (price relative to this year’s earnings) of 11.02, so it is fair to expect an increase in the company’s share price in the near future.
P/CF Ratio
An often overlooked ratio that can still be a great indicator of value is the price/cash flow metric. This ratio doesn’t take amortization and depreciation into account, so can give a more accurate picture of the financial health in a business. This is a preferred metric to some valuation investors because cash flows are (a) generally less prone to manipulation by the company’s management and (b) are less affected by variation in accounting policies between different companies.
The ratio is generally applied to find out whether a company’s stock is overpriced or underpriced with reference to its cash flows generation potential compared with its competitors. However, it is not commonly used for cross-industry comparison, as the average price to cash flow ratio varies from industry to industry.
In this case, SVB Financial’s P/CF ratio of 11.65 is slightly higher than the Zacks Banks - West industry average of 10.83, which indicates that the stock is somewhat overvalued in this respect.

Broad Value Outlook
In aggregate, SVB Financial currently has a Value Style Score of B, putting it into the top 40% of all stocks we cover from this look. This makes SIVB a solid choice for value investors.
What About the Stock Overall?
Though SVB Financial might be a good choice for value investors, there are plenty of other factors to consider before investing in this name. In particular, it is worth noting that the company has a Growth grade of F and a Momentum score of D. This gives SIVB a VGM score—or its overarching fundamental grade—of D. (You can read more about the Zacks Style Scores here >>)
Meanwhile, the company’s recent earnings estimates have been mixed at best. The current quarter has seen two estimates go higher in the past sixty days compared to six lower, while the full year estimate has seen seven upward and four downward revisions in the same time period.
This has had a noticeable impact on the consensus estimate, as the current quarter consensus estimate has fallen 4.1% in the past two months, while the full year estimate has nudged up 1%. You can see the consensus estimate trend and recent price action for the stock in the chart below:
SVB Financial Group Price and Consensus
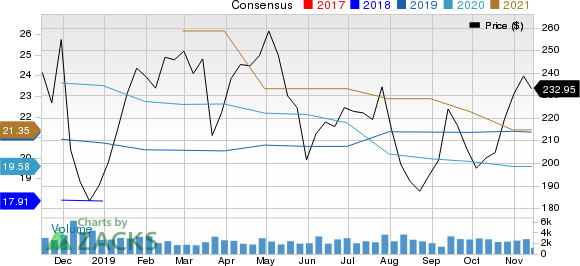
SVB Financial Group price-consensus-chart | SVB Financial Group Quote
This somewhat mixed trend is why the stock has just a Zacks Rank #3 (Hold) and why we are looking for in-line performance from the company in the near term.
Bottom Line
SVB Financial is an inspired choice for value investors, as it is hard to beat its incredible lineup of statistics on this front. However, with a sluggish industry rank (bottom 23% out of more than 250 industries) and a Zacks Rank #3, it is hard to get too excited about this company overall. In fact, over the past one year, the sector has clearly underperformed the broader market, as you can see below:

So, value investors might want to wait for broader factors and industry trend to turn favorable in this name first, but once that happens, this stock could be a compelling pick.
Free: Zacks’ Single Best Stock Set to Double
Today you are invited to download our just-released Special Report that reveals 5 stocks with the most potential to gain +100% or more in 2020. From those 5, Zacks Director of Research, Sheraz Mian hand-picks one to have the most explosive upside of all.
This pioneering tech ticker had soared to all-time highs and then subsided to a price that is irresistible. Now a pending acquisition could super-charge the company’s drive past competitors in the development of true Artificial Intelligence. The earlier you get in to this stock, the greater your potential gain.
Download Free Report Now >>
Want the latest recommendations from Zacks Investment Research? Today, you can download 7 Best Stocks for the Next 30 Days. Click to get this free report
SVB Financial Group (SIVB) : Free Stock Analysis Report
To read this article on Zacks.com click here.
Zacks Investment Research
