
 Yahoo Finance
 What Is Suncor Energy's (TSE:SU) P/E Ratio After Its Share Price Rocketed?

Suncor Energy (TSE:SU) shareholders are no doubt pleased to see that the share price has bounced 33% in the last month alone, although it is still down 51% over the last quarter. But that will do little to salve the savage burn caused by the 53% share price decline, over the last year.
Assuming no other changes, a sharply higher share price makes a stock less attractive to potential buyers. While the market sentiment towards a stock is very changeable, in the long run, the share price will tend to move in the same direction as earnings per share. The implication here is that deep value investors might steer clear when expectations of a company are too high. Perhaps the simplest way to get a read on investors' expectations of a business is to look at its Price to Earnings Ratio (PE Ratio). A high P/E ratio means that investors have a high expectation about future growth, while a low P/E ratio means they have low expectations about future growth.
Check out our latest analysis for Suncor Energy
Does Suncor Energy Have A Relatively High Or Low P/E For Its Industry?
We can tell from its P/E ratio of 11.49 that there is some investor optimism about Suncor Energy. The image below shows that Suncor Energy has a higher P/E than the average (6.7) P/E for companies in the oil and gas industry.
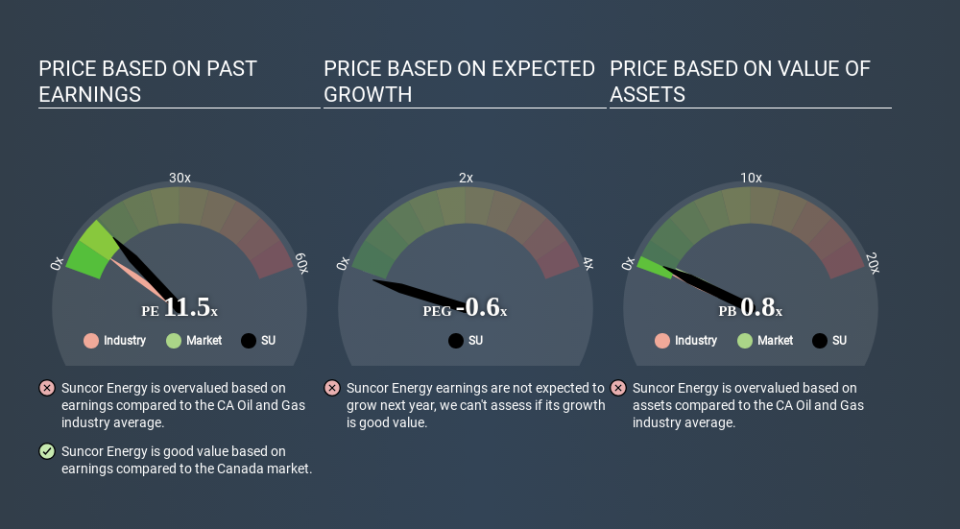
Its relatively high P/E ratio indicates that Suncor Energy shareholders think it will perform better than other companies in its industry classification. The market is optimistic about the future, but that doesn't guarantee future growth. So investors should delve deeper. I like to check if company insiders have been buying or selling.
How Growth Rates Impact P/E Ratios
Earnings growth rates have a big influence on P/E ratios. If earnings are growing quickly, then the 'E' in the equation will increase faster than it would otherwise. Therefore, even if you pay a high multiple of earnings now, that multiple will become lower in the future. And as that P/E ratio drops, the company will look cheap, unless its share price increases.
Suncor Energy saw earnings per share decrease by 8.4% last year. But over the longer term (3 years), earnings per share have increased by 90%.
A Limitation: P/E Ratios Ignore Debt and Cash In The Bank
Don't forget that the P/E ratio considers market capitalization. In other words, it does not consider any debt or cash that the company may have on the balance sheet. The exact same company would hypothetically deserve a higher P/E ratio if it had a strong balance sheet, than if it had a weak one with lots of debt, because a cashed up company can spend on growth.
Spending on growth might be good or bad a few years later, but the point is that the P/E ratio does not account for the option (or lack thereof).
So What Does Suncor Energy's Balance Sheet Tell Us?
Suncor Energy's net debt equates to 40% of its market capitalization. While it's worth keeping this in mind, it isn't a worry.
The Verdict On Suncor Energy's P/E Ratio
Suncor Energy trades on a P/E ratio of 11.5, which is fairly close to the CA market average of 11.7. Given it has some debt, but didn't grow last year, the P/E indicates the market is expecting higher profits ahead for the business. What is very clear is that the market has become more optimistic about Suncor Energy over the last month, with the P/E ratio rising from 8.6 back then to 11.5 today. For those who prefer to invest with the flow of momentum, that might mean it's time to put the stock on a watchlist, or research it. But the contrarian may see it as a missed opportunity.
Investors should be looking to buy stocks that the market is wrong about. If it is underestimating a company, investors can make money by buying and holding the shares until the market corrects itself. So this free visualization of the analyst consensus on future earnings could help you make the right decision about whether to buy, sell, or hold.
But note: Suncor Energy may not be the best stock to buy. So take a peek at this free list of interesting companies with strong recent earnings growth (and a P/E ratio below 20).
If you spot an error that warrants correction, please contact the editor at editorial-team@simplywallst.com. This article by Simply Wall St is general in nature. It does not constitute a recommendation to buy or sell any stock, and does not take account of your objectives, or your financial situation. Simply Wall St has no position in the stocks mentioned.
We aim to bring you long-term focused research analysis driven by fundamental data. Note that our analysis may not factor in the latest price-sensitive company announcements or qualitative material. Thank you for reading.
