
 Yahoo Finance
 Subdued Growth No Barrier To Calian Group Ltd.'s (TSE:CGY) Price

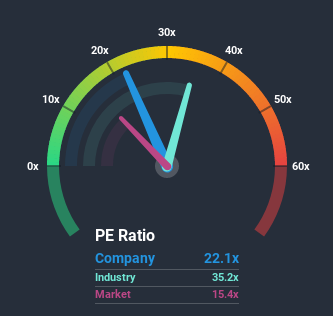
When close to half the companies in Canada have price-to-earnings ratios (or "P/E's") below 15x, you may consider Calian Group Ltd. (TSE:CGY) as a stock to potentially avoid with its 22.1x P/E ratio. However, the P/E might be high for a reason and it requires further investigation to determine if it's justified.
Calian Group certainly has been doing a good job lately as its earnings growth has been positive while most other companies have been seeing their earnings go backwards. The P/E is probably high because investors think the company will continue to navigate the broader market headwinds better than most. If not, then existing shareholders might be a little nervous about the viability of the share price.
See our latest analysis for Calian Group
Keen to find out how analysts think Calian Group's future stacks up against the industry? In that case, our free report is a great place to start.
How Is Calian Group's Growth Trending?
The only time you'd be truly comfortable seeing a P/E as high as Calian Group's is when the company's growth is on track to outshine the market.
Taking a look back first, we see that the company grew earnings per share by an impressive 38% last year. The strong recent performance means it was also able to grow EPS by 39% in total over the last three years. Accordingly, shareholders would have probably welcomed those medium-term rates of earnings growth.
Shifting to the future, estimates from the seven analysts covering the company suggest earnings growth is heading into negative territory, declining 3.0% each year over the next three years. With the market predicted to deliver 25% growth per annum, that's a disappointing outcome.
With this information, we find it concerning that Calian Group is trading at a P/E higher than the market. It seems most investors are hoping for a turnaround in the company's business prospects, but the analyst cohort is not so confident this will happen. Only the boldest would assume these prices are sustainable as these declining earnings are likely to weigh heavily on the share price eventually.
The Final Word
Typically, we'd caution against reading too much into price-to-earnings ratios when settling on investment decisions, though it can reveal plenty about what other market participants think about the company.
We've established that Calian Group currently trades on a much higher than expected P/E for a company whose earnings are forecast to decline. Right now we are increasingly uncomfortable with the high P/E as the predicted future earnings are highly unlikely to support such positive sentiment for long. This places shareholders' investments at significant risk and potential investors in danger of paying an excessive premium.
Don't forget that there may be other risks. For instance, we've identified 4 warning signs for Calian Group (1 is a bit unpleasant) you should be aware of.
If these risks are making you reconsider your opinion on Calian Group, explore our interactive list of high quality stocks to get an idea of what else is out there.
This article by Simply Wall St is general in nature. It does not constitute a recommendation to buy or sell any stock, and does not take account of your objectives, or your financial situation. We aim to bring you long-term focused analysis driven by fundamental data. Note that our analysis may not factor in the latest price-sensitive company announcements or qualitative material. Simply Wall St has no position in any stocks mentioned.
Have feedback on this article? Concerned about the content? Get in touch with us directly. Alternatively, email editorial-team@simplywallst.com.
