
 Yahoo Finance
 Strong week for Structural Monitoring Systems (ASX:SMN) shareholders doesn't alleviate pain of five-year loss
This month, we saw the Structural Monitoring Systems Plc (ASX:SMN) up an impressive 37%. But that is little comfort to those holding over the last half decade, sitting on a big loss. Indeed, the share price is down 53% in the period. So we're not so sure if the recent bounce should be celebrated. We'd err towards caution given the long term under-performance.
The recent uptick of 15% could be a positive sign of things to come, so let's take a lot at historical fundamentals.
View our latest analysis for Structural Monitoring Systems
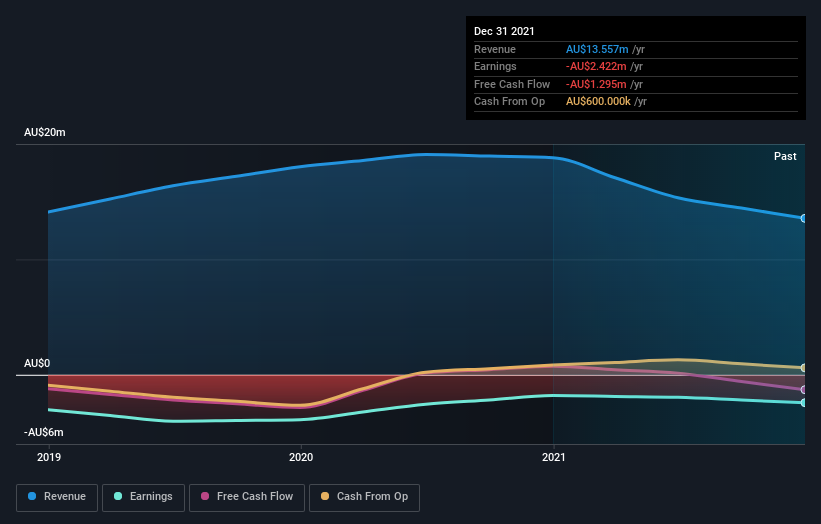
Because Structural Monitoring Systems made a loss in the last twelve months, we think the market is probably more focussed on revenue and revenue growth, at least for now. When a company doesn't make profits, we'd generally expect to see good revenue growth. That's because it's hard to be confident a company will be sustainable if revenue growth is negligible, and it never makes a profit.
In the last half decade, Structural Monitoring Systems saw its revenue increase by 35% per year. That's well above most other pre-profit companies. In contrast, the share price is has averaged a loss of 9% per year - that's quite disappointing. This could mean high expectations have been tempered, potentially because investors are looking to the bottom line. Given the revenue growth we'd consider the stock to be quite an interesting prospect if the company has a clear path to profitability.
The graphic below depicts how earnings and revenue have changed over time (unveil the exact values by clicking on the image).
We consider it positive that insiders have made significant purchases in the last year. Having said that, most people consider earnings and revenue growth trends to be a more meaningful guide to the business. Dive deeper into the earnings by checking this interactive graph of Structural Monitoring Systems' earnings, revenue and cash flow.
A Different Perspective
It's good to see that Structural Monitoring Systems has rewarded shareholders with a total shareholder return of 41% in the last twelve months. There's no doubt those recent returns are much better than the TSR loss of 9% per year over five years. We generally put more weight on the long term performance over the short term, but the recent improvement could hint at a (positive) inflection point within the business. While it is well worth considering the different impacts that market conditions can have on the share price, there are other factors that are even more important. For example, we've discovered 2 warning signs for Structural Monitoring Systems that you should be aware of before investing here.
There are plenty of other companies that have insiders buying up shares. You probably do not want to miss this free list of growing companies that insiders are buying.
Please note, the market returns quoted in this article reflect the market weighted average returns of stocks that currently trade on AU exchanges.
Have feedback on this article? Concerned about the content? Get in touch with us directly. Alternatively, email editorial-team (at) simplywallst.com.
This article by Simply Wall St is general in nature. We provide commentary based on historical data and analyst forecasts only using an unbiased methodology and our articles are not intended to be financial advice. It does not constitute a recommendation to buy or sell any stock, and does not take account of your objectives, or your financial situation. We aim to bring you long-term focused analysis driven by fundamental data. Note that our analysis may not factor in the latest price-sensitive company announcements or qualitative material. Simply Wall St has no position in any stocks mentioned.
Join A Paid User Research Session
You’ll receive a US$30 Amazon Gift card for 1 hour of your time while helping us build better investing tools for the individual investors like yourself. Sign up here
