
 Yahoo Finance
 Strong week for Bilfinger (ETR:GBF) shareholders doesn't alleviate pain of five-year loss
Bilfinger SE (ETR:GBF) shareholders should be happy to see the share price up 10% in the last quarter. But if you look at the last five years the returns have not been good. In fact, the share price is down 27%, which falls well short of the return you could get by buying an index fund.
On a more encouraging note the company has added €66m to its market cap in just the last 7 days, so let's see if we can determine what's driven the five-year loss for shareholders.
See our latest analysis for Bilfinger
In his essay The Superinvestors of Graham-and-Doddsville Warren Buffett described how share prices do not always rationally reflect the value of a business. One way to examine how market sentiment has changed over time is to look at the interaction between a company's share price and its earnings per share (EPS).
During five years of share price growth, Bilfinger moved from a loss to profitability. That would generally be considered a positive, so we are surprised to see the share price is down. Other metrics might give us a better handle on how its value is changing over time.
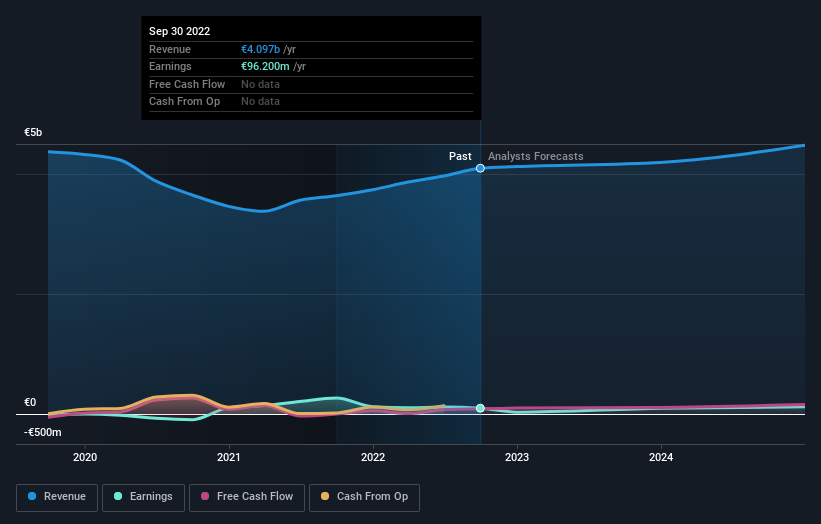
The revenue decline of 2.3% isn't too bad. But it's quite possible the market had expected better; a closer look at the revenue trends might explain the pessimism.
You can see how earnings and revenue have changed over time in the image below (click on the chart to see the exact values).
We know that Bilfinger has improved its bottom line over the last three years, but what does the future have in store? This free interactive report on Bilfinger's balance sheet strength is a great place to start, if you want to investigate the stock further.
What About Dividends?
As well as measuring the share price return, investors should also consider the total shareholder return (TSR). The TSR incorporates the value of any spin-offs or discounted capital raisings, along with any dividends, based on the assumption that the dividends are reinvested. Arguably, the TSR gives a more comprehensive picture of the return generated by a stock. We note that for Bilfinger the TSR over the last 5 years was -1.8%, which is better than the share price return mentioned above. And there's no prize for guessing that the dividend payments largely explain the divergence!
A Different Perspective
It's good to see that Bilfinger has rewarded shareholders with a total shareholder return of 11% in the last twelve months. Of course, that includes the dividend. Notably the five-year annualised TSR loss of 0.4% per year compares very unfavourably with the recent share price performance. We generally put more weight on the long term performance over the short term, but the recent improvement could hint at a (positive) inflection point within the business. It's always interesting to track share price performance over the longer term. But to understand Bilfinger better, we need to consider many other factors. Consider risks, for instance. Every company has them, and we've spotted 3 warning signs for Bilfinger you should know about.
If you would prefer to check out another company -- one with potentially superior financials -- then do not miss this free list of companies that have proven they can grow earnings.
Please note, the market returns quoted in this article reflect the market weighted average returns of stocks that currently trade on DE exchanges.
Have feedback on this article? Concerned about the content? Get in touch with us directly. Alternatively, email editorial-team (at) simplywallst.com.
This article by Simply Wall St is general in nature. We provide commentary based on historical data and analyst forecasts only using an unbiased methodology and our articles are not intended to be financial advice. It does not constitute a recommendation to buy or sell any stock, and does not take account of your objectives, or your financial situation. We aim to bring you long-term focused analysis driven by fundamental data. Note that our analysis may not factor in the latest price-sensitive company announcements or qualitative material. Simply Wall St has no position in any stocks mentioned.
Join A Paid User Research Session
You’ll receive a US$30 Amazon Gift card for 1 hour of your time while helping us build better investing tools for the individual investors like yourself. Sign up here
