Stitch Fix (SFIX) to Report Q3 Earnings: What's in the Cards?
Stitch Fix, Inc. SFIX is expected to register a decrease in both its top and the bottom line from the year-ago fiscal quarter’s reported figure in its third-quarter fiscal 2023 earnings on Jun 6, after the market close. The Zacks Consensus Estimate for quarterly revenues currently stands at $390 million, suggesting a 21% decrease from the year-ago fiscal quarter’s tally.
The consensus estimate for the fiscal first quarter’s loss is pegged at 32 cents per share, narrower than the loss of 72 cents a share recorded in the year-earlier fiscal quarter. The consensus estimate has been stable over the past 30 days.
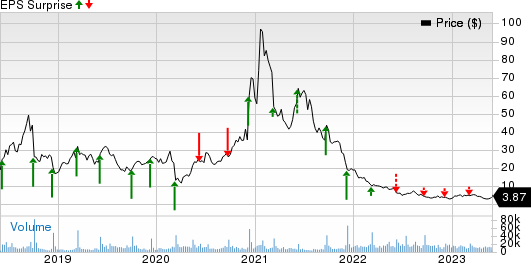
This online personal-styling service provider delivered a negative earnings surprise of 10.6% in the trailing four quarters, on average.
Factors at Play
Stitch Fix’s quarterly performance is likely to have been hurt by a tough macroeconomic environment, including headwinds like global inflationary pressures and potential shifts in customer demand. These factors coupled with any deleverage in selling, general and administrative expenses are likely to have affected SFIX’s performance in the fiscal third quarter. Also, increased investments in the Freestyle drive and new channels have been concerning.
On its last earnings call, management projected net revenues of $385-$395 million for the fiscal third quarter, indicating a decline of 20-22% from the year-ago fiscal quarter’s reported figure. Continued pressure on net active clients and higher promotional activity are likely to have hurt the metric. Stitch Fix estimated adjusted EBITDA in the bracket of a negative $5 million to a positive $5 million with a margin of minus 1% to plus 1%.
On a positive note, Stitch Fix has been expanding its digital capabilities and personalized shopping for a while to offer clients the best-in-class service. SFIX’s Freestyle drive offering quite a distinct shopping experience has been encouraging. This platform enables customers to discover and buy curated items according to their style, preferences, fit and size. These factors are expected to have provided some cushion to the quarterly performance.
What Does the Zacks Model Say?
Our proven model does not conclusively predict an earnings beat for Stitch Fix this time around. The combination of a positive Earnings ESP and a Zacks Rank #1 (Strong Buy), 2 (Buy) or 3 (Hold) increases the odds of an earnings beat. But that’s not the case here, as elaborated below. You can uncover the best stocks before they’re reported with our Earnings ESP Filter.
Stitch Fix, Inc. Price and EPS Surprise

Stitch Fix, Inc. price-eps-surprise | Stitch Fix, Inc. Quote
Stitch Fix currently has an Earnings ESP of 0.00% and a Zacks Rank #4 (Sell).
Stocks Poised to Beat Earnings Estimates
Here are a few companies, which according to our model, have the right combination of elements to come up with an earnings beat this reporting cycle:
Macy's M currently has an Earnings ESP of +2.81% and a Zacks Rank of 3. You can see the complete list of today’s Zacks #1 Rank stocks here.
The company is likely to register top- and bottom-line declines when it reports its first-quarter fiscal 2023 results. The Zacks Consensus Estimate for M’s quarterly revenues is pegged at $5.1 billion, which suggests a 4.4% fall from the figure reported in the prior-year quarter.
The consensus mark for M’s quarterly earnings has been unchanged in the past 30 days at 46 cents per share. The consensus estimate suggests a decline of 57.4% from the year-ago quarter.
Casey's General Stores CASY currently has an Earnings ESP of +0.05% and a Zacks Rank of 2.
CASY is expected to register bottom-line growth when it reports fiscal fourth-quarter 2023 results. The Zacks Consensus Estimate for earnings is pinned at $1.61 per share, indicating a rise of 0.6% from the year-ago quarter’s number.
The company’s revenues are anticipated to decrease year over year. The consensus mark for the same stands at $3.42 billion, indicating a deterioration of 1.2% from that reported in the year-ago quarter. CASY has a trailing four-quarter average earnings surprise of 9.9%.
lululemon athletica LULU currently has an Earnings ESP of +0.24% and a Zacks Rank of 3. LULU is likely to record top-line growth when it reports fiscal first-quarter 2023 results.
The Zacks Consensus Estimate for revenues is pegged at $1.9 billion, indicating a 19.5% improvement from the prior-year quarter’s reported actual. The consensus mark for earnings stands at $1.93 per share, implying a 30.4% increase from that reported in the comparable period of 2022. LULU has a trailing four-quarter earnings surprise of 6.8%, on average.
Stay on top of upcoming earnings announcements with the Zacks Earnings Calendar.
Want the latest recommendations from Zacks Investment Research? Today, you can download 7 Best Stocks for the Next 30 Days. Click to get this free report
Macy's, Inc. (M) : Free Stock Analysis Report
lululemon athletica inc. (LULU) : Free Stock Analysis Report
Casey's General Stores, Inc. (CASY) : Free Stock Analysis Report
Stitch Fix, Inc. (SFIX) : Free Stock Analysis Report

 Yahoo Finance