
 Yahoo Finance
 Steel Connect, Inc.'s (NASDAQ:STCN) Share Price Is Matching Sentiment Around Its Revenues
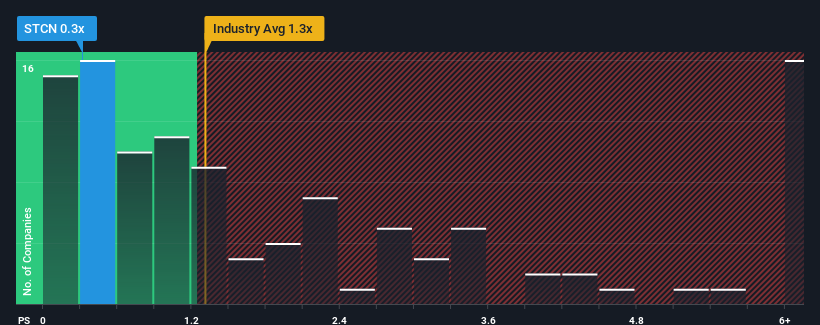
You may think that with a price-to-sales (or "P/S") ratio of 0.3x Steel Connect, Inc. (NASDAQ:STCN) is a stock worth checking out, seeing as almost half of all the Professional Services companies in the United States have P/S ratios greater than 1.3x and even P/S higher than 4x aren't out of the ordinary. However, the P/S might be low for a reason and it requires further investigation to determine if it's justified.
View our latest analysis for Steel Connect
What Does Steel Connect's P/S Mean For Shareholders?
The recent revenue growth at Steel Connect would have to be considered satisfactory if not spectacular. Perhaps the market believes the recent revenue performance might fall short of industry figures in the near future, leading to a reduced P/S. If you like the company, you'd be hoping this isn't the case so that you could potentially pick up some stock while it's out of favour.
Want the full picture on earnings, revenue and cash flow for the company? Then our free report on Steel Connect will help you shine a light on its historical performance.
How Is Steel Connect's Revenue Growth Trending?
The only time you'd be truly comfortable seeing a P/S as low as Steel Connect's is when the company's growth is on track to lag the industry.
If we review the last year of revenue growth, the company posted a worthy increase of 5.6%. However, this wasn't enough as the latest three year period has seen an unpleasant 75% overall drop in revenue. Therefore, it's fair to say the revenue growth recently has been undesirable for the company.
Comparing that to the industry, which is predicted to deliver 5.3% growth in the next 12 months, the company's downward momentum based on recent medium-term revenue results is a sobering picture.
In light of this, it's understandable that Steel Connect's P/S would sit below the majority of other companies. However, we think shrinking revenues are unlikely to lead to a stable P/S over the longer term, which could set up shareholders for future disappointment. There's potential for the P/S to fall to even lower levels if the company doesn't improve its top-line growth.
What Does Steel Connect's P/S Mean For Investors?
Using the price-to-sales ratio alone to determine if you should sell your stock isn't sensible, however it can be a practical guide to the company's future prospects.
As we suspected, our examination of Steel Connect revealed its shrinking revenue over the medium-term is contributing to its low P/S, given the industry is set to grow. At this stage investors feel the potential for an improvement in revenue isn't great enough to justify a higher P/S ratio. If recent medium-term revenue trends continue, it's hard to see the share price moving strongly in either direction in the near future under these circumstances.
You should always think about risks. Case in point, we've spotted 2 warning signs for Steel Connect you should be aware of, and 1 of them is a bit concerning.
It's important to make sure you look for a great company, not just the first idea you come across. So if growing profitability aligns with your idea of a great company, take a peek at this free list of interesting companies with strong recent earnings growth (and a low P/E).
Have feedback on this article? Concerned about the content? Get in touch with us directly. Alternatively, email editorial-team (at) simplywallst.com.
This article by Simply Wall St is general in nature. We provide commentary based on historical data and analyst forecasts only using an unbiased methodology and our articles are not intended to be financial advice. It does not constitute a recommendation to buy or sell any stock, and does not take account of your objectives, or your financial situation. We aim to bring you long-term focused analysis driven by fundamental data. Note that our analysis may not factor in the latest price-sensitive company announcements or qualitative material. Simply Wall St has no position in any stocks mentioned.
Join A Paid User Research Session
You’ll receive a US$30 Amazon Gift card for 1 hour of your time while helping us build better investing tools for the individual investors like yourself. Sign up here
