
 Yahoo Finance
 Do You Like The Star Entertainment Group Limited (ASX:SGR) At This P/E Ratio?

Today, we'll introduce the concept of the P/E ratio for those who are learning about investing. We'll show how you can use The Star Entertainment Group Limited's (ASX:SGR) P/E ratio to inform your assessment of the investment opportunity. Looking at earnings over the last twelve months, Star Entertainment Group has a P/E ratio of 21.31. In other words, at today's prices, investors are paying A$21.31 for every A$1 in prior year profit.
Check out our latest analysis for Star Entertainment Group
How Do You Calculate A P/E Ratio?
The formula for P/E is:
Price to Earnings Ratio = Share Price ÷ Earnings per Share (EPS)
Or for Star Entertainment Group:
P/E of 21.31 = A$4.60 ÷ A$0.22 (Based on the trailing twelve months to June 2019.)
Is A High P/E Ratio Good?
A higher P/E ratio means that investors are paying a higher price for each A$1 of company earnings. That isn't necessarily good or bad, but a high P/E implies relatively high expectations of what a company can achieve in the future.
Does Star Entertainment Group Have A Relatively High Or Low P/E For Its Industry?
One good way to get a quick read on what market participants expect of a company is to look at its P/E ratio. We can see in the image below that the average P/E (24.6) for companies in the hospitality industry is higher than Star Entertainment Group's P/E.
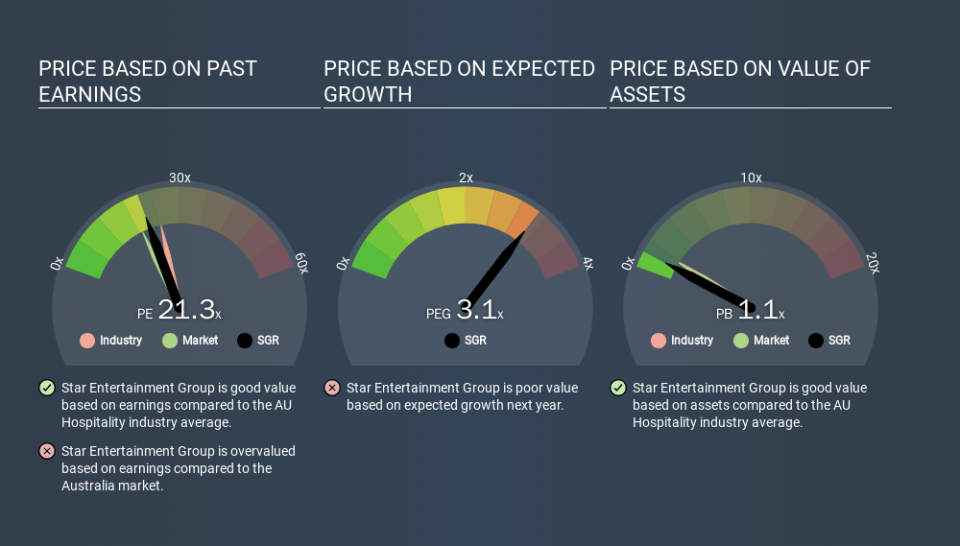
Its relatively low P/E ratio indicates that Star Entertainment Group shareholders think it will struggle to do as well as other companies in its industry classification. While current expectations are low, the stock could be undervalued if the situation is better than the market assumes. You should delve deeper. I like to check if company insiders have been buying or selling.
How Growth Rates Impact P/E Ratios
If earnings fall then in the future the 'E' will be lower. That means unless the share price falls, the P/E will increase in a few years. So while a stock may look cheap based on past earnings, it could be expensive based on future earnings.
It's great to see that Star Entertainment Group grew EPS by 23% in the last year. And it has bolstered its earnings per share by 11% per year over the last five years. This could arguably justify a relatively high P/E ratio. In contrast, EPS has decreased by 2.9%, annually, over 3 years.
A Limitation: P/E Ratios Ignore Debt and Cash In The Bank
It's important to note that the P/E ratio considers the market capitalization, not the enterprise value. In other words, it does not consider any debt or cash that the company may have on the balance sheet. Hypothetically, a company could reduce its future P/E ratio by spending its cash (or taking on debt) to achieve higher earnings.
Such expenditure might be good or bad, in the long term, but the point here is that the balance sheet is not reflected by this ratio.
How Does Star Entertainment Group's Debt Impact Its P/E Ratio?
Star Entertainment Group has net debt equal to 25% of its market cap. While it's worth keeping this in mind, it isn't a worry.
The Bottom Line On Star Entertainment Group's P/E Ratio
Star Entertainment Group trades on a P/E ratio of 21.3, which is above its market average of 18.9. The company is not overly constrained by its modest debt levels, and its recent EPS growth very solid. Therefore, it's not particularly surprising that it has a above average P/E ratio.
Investors should be looking to buy stocks that the market is wrong about. If the reality for a company is better than it expects, you can make money by buying and holding for the long term. So this free report on the analyst consensus forecasts could help you make a master move on this stock.
Of course, you might find a fantastic investment by looking at a few good candidates. So take a peek at this free list of companies with modest (or no) debt, trading on a P/E below 20.
If you spot an error that warrants correction, please contact the editor at editorial-team@simplywallst.com. This article by Simply Wall St is general in nature. It does not constitute a recommendation to buy or sell any stock, and does not take account of your objectives, or your financial situation. Simply Wall St has no position in the stocks mentioned.
We aim to bring you long-term focused research analysis driven by fundamental data. Note that our analysis may not factor in the latest price-sensitive company announcements or qualitative material. Thank you for reading.
