
 Yahoo Finance
 Has The Star Entertainment Group Limited (ASX:SGR) Been Employing Capital Shrewdly?

Today we’ll evaluate The Star Entertainment Group Limited (ASX:SGR) to determine whether it could have potential as an investment idea. Specifically, we’ll consider its Return On Capital Employed (ROCE), since that will give us an insight into how efficiently the business can generate profits from the capital it requires.
Firstly, we’ll go over how we calculate ROCE. Second, we’ll look at its ROCE compared to similar companies. Last but not least, we’ll look at what impact its current liabilities have on its ROCE.
Return On Capital Employed (ROCE): What is it?
ROCE measures the amount of pre-tax profits a company can generate from the capital employed in its business. All else being equal, a better business will have a higher ROCE. Overall, it is a valuable metric that has its flaws. Author Edwin Whiting says to be careful when comparing the ROCE of different businesses, since ‘No two businesses are exactly alike.’
So, How Do We Calculate ROCE?
The formula for calculating the return on capital employed is:
Return on Capital Employed = Earnings Before Interest and Tax (EBIT) ÷ (Total Assets – Current Liabilities)
Or for Star Entertainment Group:
0.079 = AU$394m ÷ (AU$5.4b – AU$420m) (Based on the trailing twelve months to December 2018.)
Therefore, Star Entertainment Group has an ROCE of 7.9%.
View our latest analysis for Star Entertainment Group
Does Star Entertainment Group Have A Good ROCE?
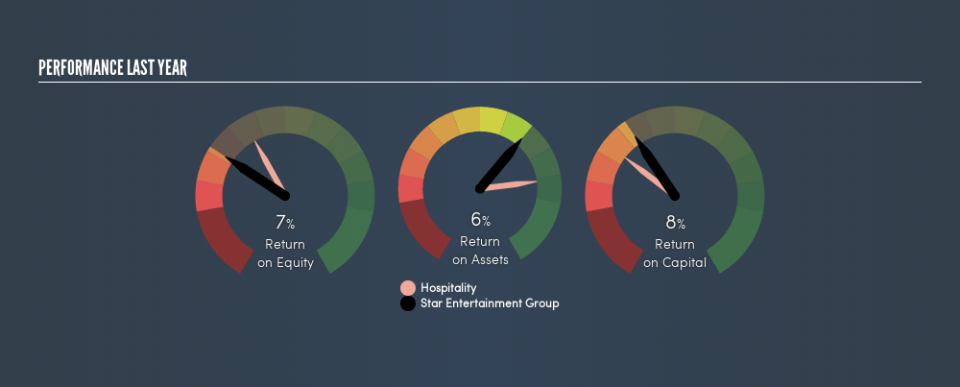
When making comparisons between similar businesses, investors may find ROCE useful. It appears that Star Entertainment Group’s ROCE is fairly close to the Hospitality industry average of 9.9%. Separate from how Star Entertainment Group stacks up against its industry, its ROCE in absolute terms is mediocre; relative to the returns on government bonds. Investors may wish to consider higher-performing investments.
Our data shows that Star Entertainment Group currently has an ROCE of 7.9%, compared to its ROCE of 5.7% 3 years ago. This makes us think about whether the company has been reinvesting shrewdly.
Remember that this metric is backwards looking – it shows what has happened in the past, and does not accurately predict the future. Companies in cyclical industries can be difficult to understand using ROCE, as returns typically look high during boom times, and low during busts. This is because ROCE only looks at one year, instead of considering returns across a whole cycle. What happens in the future is pretty important for investors, so we have prepared a free report on analyst forecasts for Star Entertainment Group.
What Are Current Liabilities, And How Do They Affect Star Entertainment Group’s ROCE?
Short term (or current) liabilities, are things like supplier invoices, overdrafts, or tax bills that need to be paid within 12 months. Due to the way the ROCE equation works, having large bills due in the near term can make it look as though a company has less capital employed, and thus a higher ROCE than usual. To counter this, investors can check if a company has high current liabilities relative to total assets.
Star Entertainment Group has total assets of AU$5.4b and current liabilities of AU$420m. Therefore its current liabilities are equivalent to approximately 7.8% of its total assets. Star Entertainment Group has a low level of current liabilities, which have a minimal impact on its uninspiring ROCE.
The Bottom Line On Star Entertainment Group’s ROCE
If performance improves, then Star Entertainment Group may be an OK investment, especially at the right valuation. You might be able to find a better buy than Star Entertainment Group. If you want a selection of possible winners, check out this free list of interesting companies that trade on a P/E below 20 (but have proven they can grow earnings).
For those who like to find winning investments this free list of growing companies with recent insider purchasing, could be just the ticket.
We aim to bring you long-term focused research analysis driven by fundamental data. Note that our analysis may not factor in the latest price-sensitive company announcements or qualitative material.
If you spot an error that warrants correction, please contact the editor at editorial-team@simplywallst.com. This article by Simply Wall St is general in nature. It does not constitute a recommendation to buy or sell any stock, and does not take account of your objectives, or your financial situation. Simply Wall St has no position in the stocks mentioned. Thank you for reading.
