
 Yahoo Finance
 Stanley Black & Decker (NYSE:SWK) sheds 3.2% this week, as yearly returns fall more in line with earnings growth
The main point of investing for the long term is to make money. But more than that, you probably want to see it rise more than the market average. Unfortunately for shareholders, while the Stanley Black & Decker, Inc. (NYSE:SWK) share price is up 56% in the last five years, that's less than the market return. Meanwhile, the last twelve months saw the share price rise 2.3%.
While the stock has fallen 3.2% this week, it's worth focusing on the longer term and seeing if the stocks historical returns have been driven by the underlying fundamentals.
View our latest analysis for Stanley Black & Decker
To quote Buffett, 'Ships will sail around the world but the Flat Earth Society will flourish. There will continue to be wide discrepancies between price and value in the marketplace...' By comparing earnings per share (EPS) and share price changes over time, we can get a feel for how investor attitudes to a company have morphed over time.
Over half a decade, Stanley Black & Decker managed to grow its earnings per share at 11% a year. So the EPS growth rate is rather close to the annualized share price gain of 9% per year. This indicates that investor sentiment towards the company has not changed a great deal. Indeed, it would appear the share price is reacting to the EPS.
You can see how EPS has changed over time in the image below (click on the chart to see the exact values).
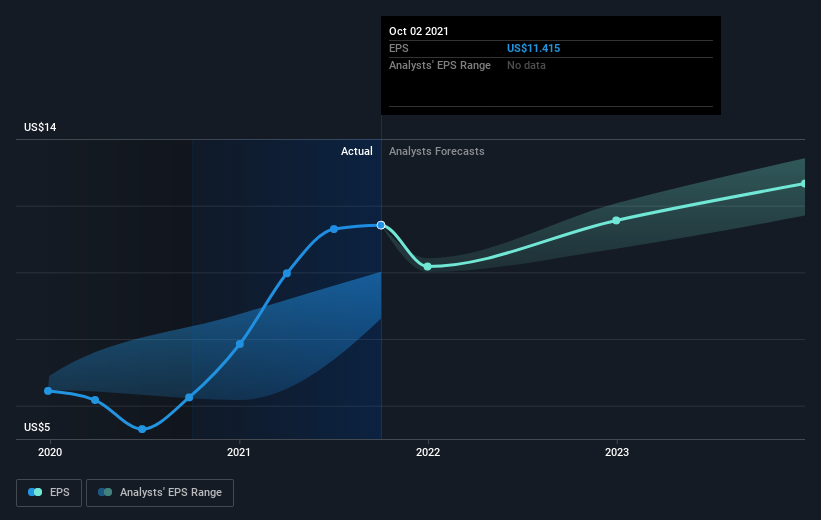
We know that Stanley Black & Decker has improved its bottom line lately, but is it going to grow revenue? You could check out this free report showing analyst revenue forecasts.
What About Dividends?
As well as measuring the share price return, investors should also consider the total shareholder return (TSR). The TSR is a return calculation that accounts for the value of cash dividends (assuming that any dividend received was reinvested) and the calculated value of any discounted capital raisings and spin-offs. So for companies that pay a generous dividend, the TSR is often a lot higher than the share price return. We note that for Stanley Black & Decker the TSR over the last 5 years was 71%, which is better than the share price return mentioned above. This is largely a result of its dividend payments!
A Different Perspective
Stanley Black & Decker shareholders are up 3.8% for the year (even including dividends). Unfortunately this falls short of the market return. If we look back over five years, the returns are even better, coming in at 11% per year for five years. It's quite possible the business continues to execute with prowess, even as the share price gains are slowing. If you would like to research Stanley Black & Decker in more detail then you might want to take a look at whether insiders have been buying or selling shares in the company.
We will like Stanley Black & Decker better if we see some big insider buys. While we wait, check out this free list of growing companies with considerable, recent, insider buying.
Please note, the market returns quoted in this article reflect the market weighted average returns of stocks that currently trade on US exchanges.
This article by Simply Wall St is general in nature. We provide commentary based on historical data and analyst forecasts only using an unbiased methodology and our articles are not intended to be financial advice. It does not constitute a recommendation to buy or sell any stock, and does not take account of your objectives, or your financial situation. We aim to bring you long-term focused analysis driven by fundamental data. Note that our analysis may not factor in the latest price-sensitive company announcements or qualitative material. Simply Wall St has no position in any stocks mentioned.
Have feedback on this article? Concerned about the content? Get in touch with us directly. Alternatively, email editorial-team (at) simplywallst.com.
