
 Yahoo Finance
 Stadler Rail (VTX:SRAIL) Hasn't Managed To Accelerate Its Returns
If we want to find a potential multi-bagger, often there are underlying trends that can provide clues. Amongst other things, we'll want to see two things; firstly, a growing return on capital employed (ROCE) and secondly, an expansion in the company's amount of capital employed. This shows us that it's a compounding machine, able to continually reinvest its earnings back into the business and generate higher returns. With that in mind, the ROCE of Stadler Rail (VTX:SRAIL) looks decent, right now, so lets see what the trend of returns can tell us.
Return On Capital Employed (ROCE): What Is It?
For those who don't know, ROCE is a measure of a company's yearly pre-tax profit (its return), relative to the capital employed in the business. The formula for this calculation on Stadler Rail is:
Return on Capital Employed = Earnings Before Interest and Tax (EBIT) ÷ (Total Assets - Current Liabilities)
0.16 = CHF216m ÷ (CHF4.4b - CHF3.0b) (Based on the trailing twelve months to June 2022).
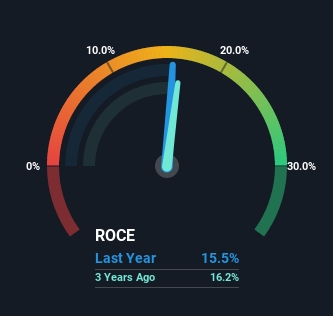
So, Stadler Rail has an ROCE of 16%. That's a pretty standard return and it's in line with the industry average of 16%.
View our latest analysis for Stadler Rail
In the above chart we have measured Stadler Rail's prior ROCE against its prior performance, but the future is arguably more important. If you'd like, you can check out the forecasts from the analysts covering Stadler Rail here for free.
How Are Returns Trending?
While the current returns on capital are decent, they haven't changed much. Over the past four years, ROCE has remained relatively flat at around 16% and the business has deployed 41% more capital into its operations. 16% is a pretty standard return, and it provides some comfort knowing that Stadler Rail has consistently earned this amount. Over long periods of time, returns like these might not be too exciting, but with consistency they can pay off in terms of share price returns.
On a separate but related note, it's important to know that Stadler Rail has a current liabilities to total assets ratio of 68%, which we'd consider pretty high. This can bring about some risks because the company is basically operating with a rather large reliance on its suppliers or other sorts of short-term creditors. Ideally we'd like to see this reduce as that would mean fewer obligations bearing risks.
The Key Takeaway
To sum it up, Stadler Rail has simply been reinvesting capital steadily, at those decent rates of return. However, despite the favorable fundamentals, the stock has fallen 26% over the last three years, so there might be an opportunity here for astute investors. For that reason, savvy investors might want to look further into this company in case it's a prime investment.
If you want to continue researching Stadler Rail, you might be interested to know about the 3 warning signs that our analysis has discovered.
While Stadler Rail isn't earning the highest return, check out this free list of companies that are earning high returns on equity with solid balance sheets.
Have feedback on this article? Concerned about the content? Get in touch with us directly. Alternatively, email editorial-team (at) simplywallst.com.
This article by Simply Wall St is general in nature. We provide commentary based on historical data and analyst forecasts only using an unbiased methodology and our articles are not intended to be financial advice. It does not constitute a recommendation to buy or sell any stock, and does not take account of your objectives, or your financial situation. We aim to bring you long-term focused analysis driven by fundamental data. Note that our analysis may not factor in the latest price-sensitive company announcements or qualitative material. Simply Wall St has no position in any stocks mentioned.
Join A Paid User Research Session
You’ll receive a US$30 Amazon Gift card for 1 hour of your time while helping us build better investing tools for the individual investors like yourself. Sign up here
