
 Yahoo Finance
 Is Spirit Airlines, Inc.'s (NYSE:SAVE) Balance Sheet Strong Enough To Weather A Storm?

Investors are always looking for growth in small-cap stocks like Spirit Airlines, Inc. (NYSE:SAVE), with a market cap of US$3.8b. However, an important fact which most ignore is: how financially healthy is the business? Evaluating financial health as part of your investment thesis is essential, as mismanagement of capital can lead to bankruptcies, which occur at a higher rate for small-caps. The following basic checks can help you get a picture of the company's balance sheet strength. Nevertheless, this is not a comprehensive overview, so I suggest you dig deeper yourself into SAVE here.
Does SAVE Produce Much Cash Relative To Its Debt?
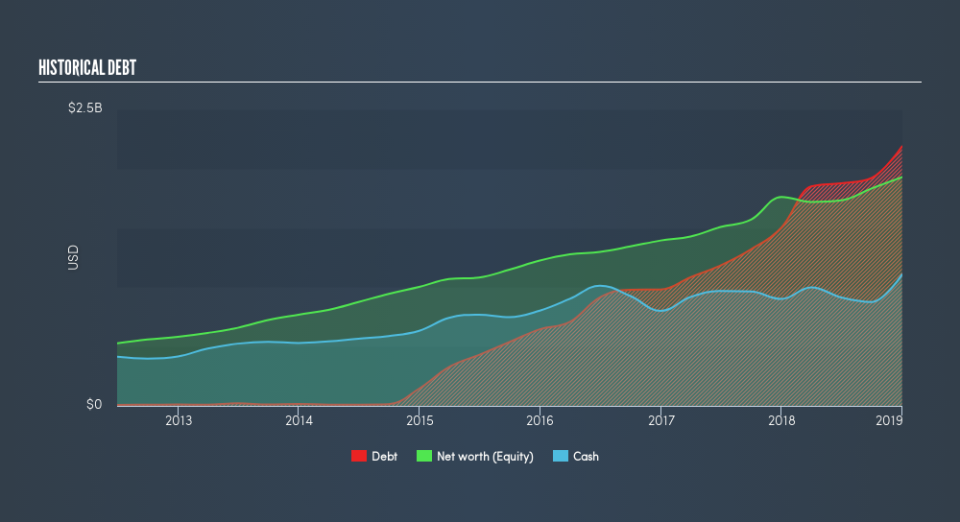
Over the past year, SAVE has ramped up its debt from US$1.5b to US$2.2b , which accounts for long term debt. With this growth in debt, SAVE's cash and short-term investments stands at US$1.1b to keep the business going. On top of this, SAVE has generated cash from operations of US$506m in the last twelve months, resulting in an operating cash to total debt ratio of 23%, meaning that SAVE’s operating cash is sufficient to cover its debt.
Does SAVE’s liquid assets cover its short-term commitments?
With current liabilities at US$835m, the company has maintained a safe level of current assets to meet its obligations, with the current ratio last standing at 1.61x. The current ratio is calculated by dividing current assets by current liabilities. For Airlines companies, this ratio is within a sensible range since there's a sufficient cash cushion without leaving too much capital idle or in low-earning investments.
Does SAVE face the risk of succumbing to its debt-load?
SAVE is a highly-leveraged company with debt exceeding equity by over 100%. This is somewhat unusual for small-caps companies, since lenders are often hesitant to provide attractive interest rates to less-established businesses. We can check to see whether SAVE is able to meet its debt obligations by looking at the net interest coverage ratio. A company generating earnings before interest and tax (EBIT) at least three times its net interest payments is considered financially sound. In SAVE's, case, the ratio of 8.2x suggests that interest is appropriately covered, which means that debtors may be willing to loan the company more money, giving SAVE ample headroom to grow its debt facilities.
Next Steps:
Although SAVE’s debt level is towards the higher end of the spectrum, its cash flow coverage seems adequate to meet obligations which means its debt is being efficiently utilised. Since there is also no concerns around SAVE's liquidity needs, this may be its optimal capital structure for the time being. I admit this is a fairly basic analysis for SAVE's financial health. Other important fundamentals need to be considered alongside. I suggest you continue to research Spirit Airlines to get a more holistic view of the small-cap by looking at:
Future Outlook: What are well-informed industry analysts predicting for SAVE’s future growth? Take a look at our free research report of analyst consensus for SAVE’s outlook.
Historical Performance: What has SAVE's returns been like over the past? Go into more detail in the past track record analysis and take a look at the free visual representations of our analysis for more clarity.
Other High-Performing Stocks: Are there other stocks that provide better prospects with proven track records? Explore our free list of these great stocks here.
We aim to bring you long-term focused research analysis driven by fundamental data. Note that our analysis may not factor in the latest price-sensitive company announcements or qualitative material.
If you spot an error that warrants correction, please contact the editor at editorial-team@simplywallst.com. This article by Simply Wall St is general in nature. It does not constitute a recommendation to buy or sell any stock, and does not take account of your objectives, or your financial situation. Simply Wall St has no position in the stocks mentioned. Thank you for reading.
