
 Yahoo Finance
 South32's (ASX:S32) five-year total shareholder returns outpace the underlying earnings growth
Some South32 Limited (ASX:S32) shareholders are probably rather concerned to see the share price fall 34% over the last three months. But at least the stock is up over the last five years. In that time, it is up 25%, which isn't bad, but is below the market return of 44%.
Since the long term performance has been good but there's been a recent pullback of 8.6%, let's check if the fundamentals match the share price.
See our latest analysis for South32
There is no denying that markets are sometimes efficient, but prices do not always reflect underlying business performance. By comparing earnings per share (EPS) and share price changes over time, we can get a feel for how investor attitudes to a company have morphed over time.
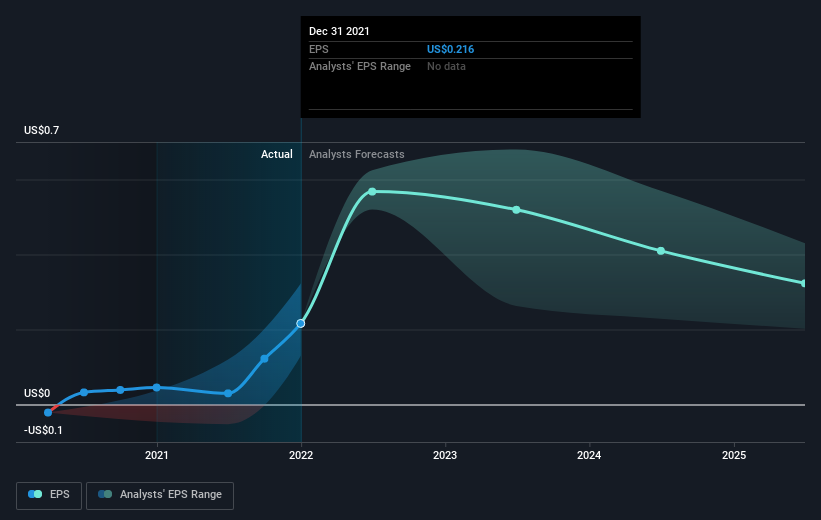
Over half a decade, South32 managed to grow its earnings per share at 9.2% a year. The EPS growth is more impressive than the yearly share price gain of 5% over the same period. So one could conclude that the broader market has become more cautious towards the stock. This cautious sentiment is reflected in its (fairly low) P/E ratio of 10.56.
The company's earnings per share (over time) is depicted in the image below (click to see the exact numbers).
We know that South32 has improved its bottom line lately, but is it going to grow revenue? Check if analysts think South32 will grow revenue in the future.
What About Dividends?
When looking at investment returns, it is important to consider the difference between total shareholder return (TSR) and share price return. The TSR is a return calculation that accounts for the value of cash dividends (assuming that any dividend received was reinvested) and the calculated value of any discounted capital raisings and spin-offs. It's fair to say that the TSR gives a more complete picture for stocks that pay a dividend. We note that for South32 the TSR over the last 5 years was 52%, which is better than the share price return mentioned above. This is largely a result of its dividend payments!
A Different Perspective
It's good to see that South32 has rewarded shareholders with a total shareholder return of 20% in the last twelve months. That's including the dividend. That's better than the annualised return of 9% over half a decade, implying that the company is doing better recently. In the best case scenario, this may hint at some real business momentum, implying that now could be a great time to delve deeper. While it is well worth considering the different impacts that market conditions can have on the share price, there are other factors that are even more important. Case in point: We've spotted 3 warning signs for South32 you should be aware of, and 1 of them is potentially serious.
If you are like me, then you will not want to miss this free list of growing companies that insiders are buying.
Please note, the market returns quoted in this article reflect the market weighted average returns of stocks that currently trade on AU exchanges.
Have feedback on this article? Concerned about the content? Get in touch with us directly. Alternatively, email editorial-team (at) simplywallst.com.
This article by Simply Wall St is general in nature. We provide commentary based on historical data and analyst forecasts only using an unbiased methodology and our articles are not intended to be financial advice. It does not constitute a recommendation to buy or sell any stock, and does not take account of your objectives, or your financial situation. We aim to bring you long-term focused analysis driven by fundamental data. Note that our analysis may not factor in the latest price-sensitive company announcements or qualitative material. Simply Wall St has no position in any stocks mentioned.
Join A Paid User Research Session
You’ll receive a US$30 Amazon Gift card for 1 hour of your time while helping us build better investing tools for the individual investors like yourself. Sign up here
