
 Yahoo Finance
 Is Somero Enterprises, Inc.'s (LON:SOM) Recent Stock Performance Tethered To Its Strong Fundamentals?
Somero Enterprises' (LON:SOM) stock is up by a considerable 13% over the past month. Given the company's impressive performance, we decided to study its financial indicators more closely as a company's financial health over the long-term usually dictates market outcomes. Specifically, we decided to study Somero Enterprises' ROE in this article.
Return on Equity or ROE is a test of how effectively a company is growing its value and managing investors’ money. Put another way, it reveals the company's success at turning shareholder investments into profits.
Check out our latest analysis for Somero Enterprises
How Do You Calculate Return On Equity?
Return on equity can be calculated by using the formula:
Return on Equity = Net Profit (from continuing operations) ÷ Shareholders' Equity
So, based on the above formula, the ROE for Somero Enterprises is:
34% = US$28m ÷ US$83m (Based on the trailing twelve months to December 2023).
The 'return' is the yearly profit. Another way to think of that is that for every £1 worth of equity, the company was able to earn £0.34 in profit.
What Is The Relationship Between ROE And Earnings Growth?
Thus far, we have learned that ROE measures how efficiently a company is generating its profits. We now need to evaluate how much profit the company reinvests or "retains" for future growth which then gives us an idea about the growth potential of the company. Assuming everything else remains unchanged, the higher the ROE and profit retention, the higher the growth rate of a company compared to companies that don't necessarily bear these characteristics.
A Side By Side comparison of Somero Enterprises' Earnings Growth And 34% ROE
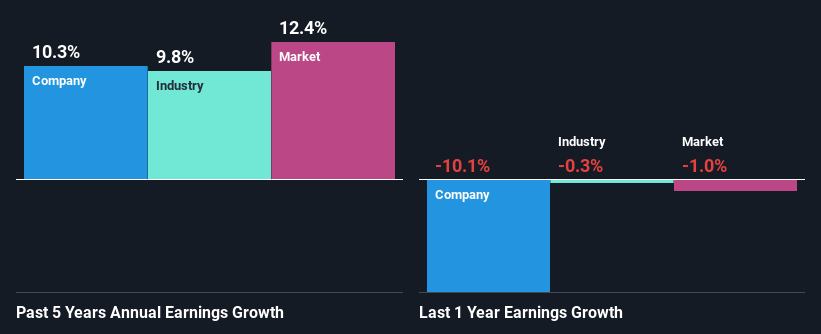
Firstly, we acknowledge that Somero Enterprises has a significantly high ROE. Secondly, even when compared to the industry average of 14% the company's ROE is quite impressive. Probably as a result of this, Somero Enterprises was able to see a decent net income growth of 10% over the last five years.
We then performed a comparison between Somero Enterprises' net income growth with the industry, which revealed that the company's growth is similar to the average industry growth of 9.8% in the same 5-year period.
Earnings growth is a huge factor in stock valuation. What investors need to determine next is if the expected earnings growth, or the lack of it, is already built into the share price. This then helps them determine if the stock is placed for a bright or bleak future. Is Somero Enterprises fairly valued compared to other companies? These 3 valuation measures might help you decide.
Is Somero Enterprises Using Its Retained Earnings Effectively?
The high three-year median payout ratio of 50% (or a retention ratio of 50%) for Somero Enterprises suggests that the company's growth wasn't really hampered despite it returning most of its income to its shareholders.
Moreover, Somero Enterprises is determined to keep sharing its profits with shareholders which we infer from its long history of paying a dividend for at least ten years.
Conclusion
Overall, we are quite pleased with Somero Enterprises' performance. In particular, its high ROE is quite noteworthy and also the probable explanation behind its considerable earnings growth. Yet, the company is retaining a small portion of its profits. Which means that the company has been able to grow its earnings in spite of it, so that's not too bad. Up till now, we've only made a short study of the company's growth data. You can do your own research on Somero Enterprises and see how it has performed in the past by looking at this FREE detailed graph of past earnings, revenue and cash flows.
Have feedback on this article? Concerned about the content? Get in touch with us directly. Alternatively, email editorial-team (at) simplywallst.com.
This article by Simply Wall St is general in nature. We provide commentary based on historical data and analyst forecasts only using an unbiased methodology and our articles are not intended to be financial advice. It does not constitute a recommendation to buy or sell any stock, and does not take account of your objectives, or your financial situation. We aim to bring you long-term focused analysis driven by fundamental data. Note that our analysis may not factor in the latest price-sensitive company announcements or qualitative material. Simply Wall St has no position in any stocks mentioned.
