
 Yahoo Finance
 Solaris Oilfield Infrastructure's (NYSE:SOI) Returns On Capital Are Heading Higher
To find a multi-bagger stock, what are the underlying trends we should look for in a business? One common approach is to try and find a company with returns on capital employed (ROCE) that are increasing, in conjunction with a growing amount of capital employed. Basically this means that a company has profitable initiatives that it can continue to reinvest in, which is a trait of a compounding machine. So on that note, Solaris Oilfield Infrastructure (NYSE:SOI) looks quite promising in regards to its trends of return on capital.
Understanding Return On Capital Employed (ROCE)
If you haven't worked with ROCE before, it measures the 'return' (pre-tax profit) a company generates from capital employed in its business. To calculate this metric for Solaris Oilfield Infrastructure, this is the formula:
Return on Capital Employed = Earnings Before Interest and Tax (EBIT) ÷ (Total Assets - Current Liabilities)
0.11 = US$46m ÷ (US$463m - US$56m) (Based on the trailing twelve months to December 2022).
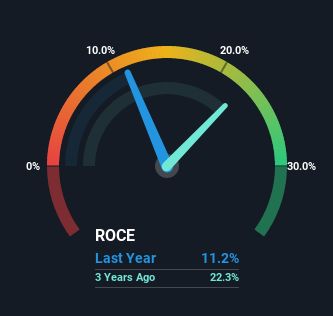
So, Solaris Oilfield Infrastructure has an ROCE of 11%. On its own, that's a standard return, however it's much better than the 9.0% generated by the Energy Services industry.
View our latest analysis for Solaris Oilfield Infrastructure
Above you can see how the current ROCE for Solaris Oilfield Infrastructure compares to its prior returns on capital, but there's only so much you can tell from the past. If you'd like to see what analysts are forecasting going forward, you should check out our free report for Solaris Oilfield Infrastructure.
What Can We Tell From Solaris Oilfield Infrastructure's ROCE Trend?
Investors would be pleased with what's happening at Solaris Oilfield Infrastructure. Over the last five years, returns on capital employed have risen substantially to 11%. The company is effectively making more money per dollar of capital used, and it's worth noting that the amount of capital has increased too, by 46%. This can indicate that there's plenty of opportunities to invest capital internally and at ever higher rates, a combination that's common among multi-baggers.
In Conclusion...
All in all, it's terrific to see that Solaris Oilfield Infrastructure is reaping the rewards from prior investments and is growing its capital base. And since the stock has fallen 47% over the last five years, there might be an opportunity here. So researching this company further and determining whether or not these trends will continue seems justified.
Like most companies, Solaris Oilfield Infrastructure does come with some risks, and we've found 1 warning sign that you should be aware of.
While Solaris Oilfield Infrastructure isn't earning the highest return, check out this free list of companies that are earning high returns on equity with solid balance sheets.
Have feedback on this article? Concerned about the content? Get in touch with us directly. Alternatively, email editorial-team (at) simplywallst.com.
This article by Simply Wall St is general in nature. We provide commentary based on historical data and analyst forecasts only using an unbiased methodology and our articles are not intended to be financial advice. It does not constitute a recommendation to buy or sell any stock, and does not take account of your objectives, or your financial situation. We aim to bring you long-term focused analysis driven by fundamental data. Note that our analysis may not factor in the latest price-sensitive company announcements or qualitative material. Simply Wall St has no position in any stocks mentioned.
Join A Paid User Research Session
You’ll receive a US$30 Amazon Gift card for 1 hour of your time while helping us build better investing tools for the individual investors like yourself. Sign up here
