
 Yahoo Finance
 Smith & Nephew plc (LON:SN.): Financial Strength Analysis

Want to participate in a short research study? Help shape the future of investing tools and you could win a $250 gift card!
Smith & Nephew plc (LON:SN.), a large-cap worth UK£13b, comes to mind for investors seeking a strong and reliable stock investment. Most investors favour these big stocks due to their strong balance sheet and high market liquidity, meaning there are an abundance of stock in the public market available for trading. These firms won’t be left high and dry if liquidity dries up, and they will be relatively unaffected by rises in interest rates. Assessing the most recent data for SN., I will take you through the key ratios to measure financial health, in particular, its solvency and liquidity.
View our latest analysis for Smith & Nephew
How does SN.’s operating cash flow stack up against its debt?
SN. has sustained its debt level by about US$1.5b over the last 12 months including long-term debt. At this current level of debt, the current cash and short-term investment levels stands at US$365m , ready to deploy into the business. Additionally, SN. has produced US$931m in operating cash flow during the same period of time, resulting in an operating cash to total debt ratio of 64%, meaning that SN.’s operating cash is sufficient to cover its debt. This ratio can also be interpreted as a measure of efficiency as an alternative to return on assets. In SN.’s case, it is able to generate 0.64x cash from its debt capital.
Can SN. pay its short-term liabilities?
With current liabilities at US$1.5b, it appears that the company has maintained a safe level of current assets to meet its obligations, with the current ratio last standing at 2.1x. For Medical Equipment companies, this ratio is within a sensible range as there’s enough of a cash buffer without holding too much capital in low return investments.
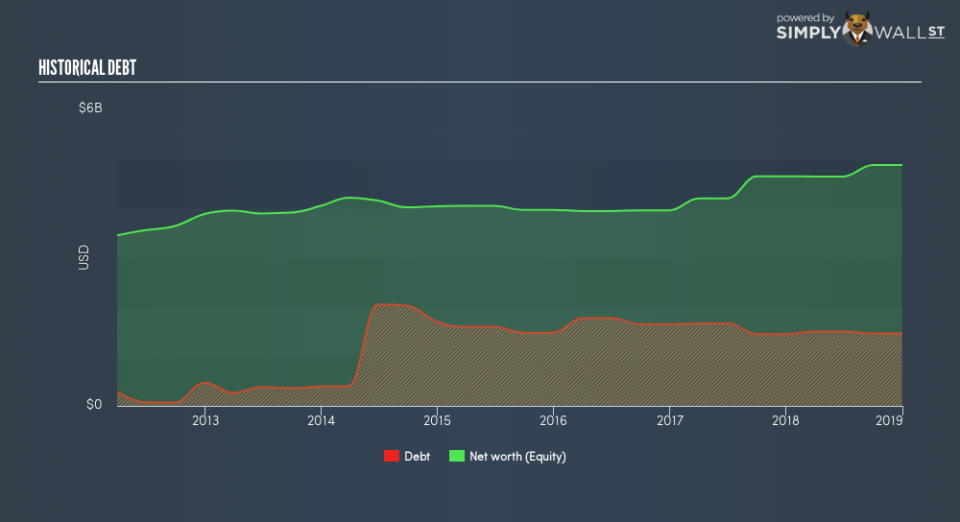
Is SN.’s debt level acceptable?
With debt at 30% of equity, SN. may be thought of as appropriately levered. SN. is not taking on too much debt commitment, which may be constraining for future growth. We can test if SN.’s debt levels are sustainable by measuring interest payments against earnings of a company. As a rule of thumb, a company should have earnings before interest and tax (EBIT) of at least three times the size of net interest. For SN., the ratio of 16.92x suggests that interest is amply covered. Large-cap investments like SN. are often believed to be a safe investment due to their ability to pump out ample earnings multiple times its interest payments.
Next Steps:
SN.’s debt level is appropriate for a company its size, and it is also able to generate sufficient cash flow coverage, meaning it has been able to put its debt in good use. Furthermore, the company exhibits an ability to meet its near-term obligations, which isn’t a big surprise for a large-cap. I admit this is a fairly basic analysis for SN.’s financial health. Other important fundamentals need to be considered alongside. I recommend you continue to research Smith & Nephew to get a more holistic view of the stock by looking at:
Future Outlook: What are well-informed industry analysts predicting for SN.’s future growth? Take a look at our free research report of analyst consensus for SN.’s outlook.
Valuation: What is SN. worth today? Is the stock undervalued, even when its growth outlook is factored into its intrinsic value? The intrinsic value infographic in our free research report helps visualize whether SN. is currently mispriced by the market.
Other High-Performing Stocks: Are there other stocks that provide better prospects with proven track records? Explore our free list of these great stocks here.
To help readers see past the short term volatility of the financial market, we aim to bring you a long-term focused research analysis purely driven by fundamental data. Note that our analysis does not factor in the latest price-sensitive company announcements.
The author is an independent contributor and at the time of publication had no position in the stocks mentioned. For errors that warrant correction please contact the editor at editorial-team@simplywallst.com.
