
 Yahoo Finance
 A Sliding Share Price Has Us Looking At Webjet Limited's (ASX:WEB) P/E Ratio

Unfortunately for some shareholders, the Webjet (ASX:WEB) share price has dived 70% in the last thirty days. Given the 75% drop over the last year, some shareholders might be worried that they have become bagholders. What is a bagholder? It is a shareholder who has suffered a bad loss, but continues to hold indefinitely, without questioning their reasons for holding, even as the losses grow greater.
All else being equal, a share price drop should make a stock more attractive to potential investors. While the market sentiment towards a stock is very changeable, in the long run, the share price will tend to move in the same direction as earnings per share. The implication here is that long term investors have an opportunity when expectations of a company are too low. One way to gauge market expectations of a stock is to look at its Price to Earnings Ratio (PE Ratio). A high P/E implies that investors have high expectations of what a company can achieve compared to a company with a low P/E ratio.
Check out our latest analysis for Webjet
How Does Webjet's P/E Ratio Compare To Its Peers?
We can tell from its P/E ratio of 11.56 that sentiment around Webjet isn't particularly high. If you look at the image below, you can see Webjet has a lower P/E than the average (17.3) in the online retail industry classification.
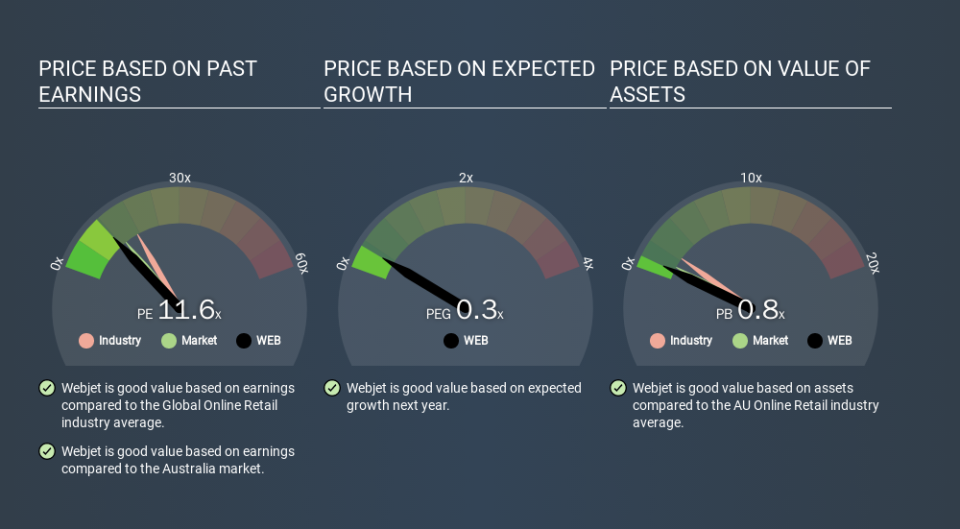
Webjet's P/E tells us that market participants think it will not fare as well as its peers in the same industry. While current expectations are low, the stock could be undervalued if the situation is better than the market assumes. You should delve deeper. I like to check if company insiders have been buying or selling.
How Growth Rates Impact P/E Ratios
When earnings fall, the 'E' decreases, over time. That means even if the current P/E is low, it will increase over time if the share price stays flat. Then, a higher P/E might scare off shareholders, pushing the share price down.
Webjet shrunk earnings per share by 19% over the last year. But it has grown its earnings per share by 6.1% per year over the last five years. And EPS is down 14% a year, over the last 3 years. This growth rate might warrant a low P/E ratio.
Don't Forget: The P/E Does Not Account For Debt or Bank Deposits
The 'Price' in P/E reflects the market capitalization of the company. Thus, the metric does not reflect cash or debt held by the company. In theory, a company can lower its future P/E ratio by using cash or debt to invest in growth.
Such expenditure might be good or bad, in the long term, but the point here is that the balance sheet is not reflected by this ratio.
How Does Webjet's Debt Impact Its P/E Ratio?
Webjet has net debt worth just 6.8% of its market capitalization. The market might award it a higher P/E ratio if it had net cash, but its unlikely this low level of net borrowing is having a big impact on the P/E multiple.
The Bottom Line On Webjet's P/E Ratio
Webjet trades on a P/E ratio of 11.6, which is below the AU market average of 13.3. Since it only carries a modest debt load, it's likely the low expectations implied by the P/E ratio arise from the lack of recent earnings growth. Given Webjet's P/E ratio has declined from 38.1 to 11.6 in the last month, we know for sure that the market is significantly less confident about the business today, than it was back then. For those who don't like to trade against momentum, that could be a warning sign, but a contrarian investor might want to take a closer look.
When the market is wrong about a stock, it gives savvy investors an opportunity. As value investor Benjamin Graham famously said, 'In the short run, the market is a voting machine but in the long run, it is a weighing machine. So this free visualization of the analyst consensus on future earnings could help you make the right decision about whether to buy, sell, or hold.
Of course, you might find a fantastic investment by looking at a few good candidates. So take a peek at this free list of companies with modest (or no) debt, trading on a P/E below 20.
If you spot an error that warrants correction, please contact the editor at editorial-team@simplywallst.com. This article by Simply Wall St is general in nature. It does not constitute a recommendation to buy or sell any stock, and does not take account of your objectives, or your financial situation. Simply Wall St has no position in the stocks mentioned.
We aim to bring you long-term focused research analysis driven by fundamental data. Note that our analysis may not factor in the latest price-sensitive company announcements or qualitative material. Thank you for reading.
