
 Yahoo Finance
 A Sliding Share Price Has Us Looking At Cue Energy Resources Limited's (ASX:CUE) P/E Ratio

To the annoyance of some shareholders, Cue Energy Resources (ASX:CUE) shares are down a considerable 48% in the last month. Indeed, the recent drop has reduced the annual gain to a relatively sedate 6.3% over the last twelve months.
All else being equal, a share price drop should make a stock more attractive to potential investors. In the long term, share prices tend to follow earnings per share, but in the short term prices bounce around in response to short term factors (which are not always obvious). The implication here is that long term investors have an opportunity when expectations of a company are too low. Perhaps the simplest way to get a read on investors' expectations of a business is to look at its Price to Earnings Ratio (PE Ratio). Investors have optimistic expectations of companies with higher P/E ratios, compared to companies with lower P/E ratios.
See our latest analysis for Cue Energy Resources
Does Cue Energy Resources Have A Relatively High Or Low P/E For Its Industry?
Cue Energy Resources's P/E of 8.82 indicates some degree of optimism towards the stock. You can see in the image below that the average P/E (7.6) for companies in the oil and gas industry is lower than Cue Energy Resources's P/E.
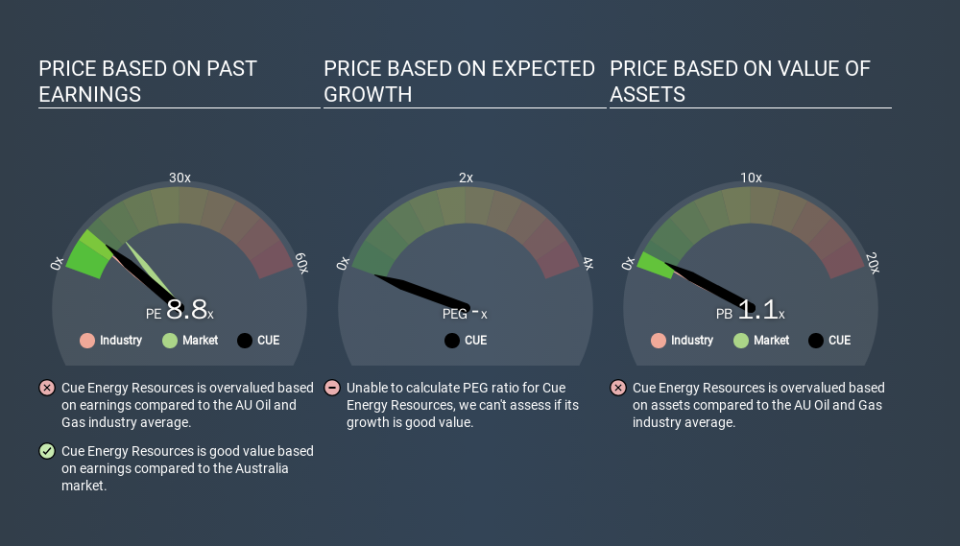
That means that the market expects Cue Energy Resources will outperform other companies in its industry. Clearly the market expects growth, but it isn't guaranteed. So investors should delve deeper. I like to check if company insiders have been buying or selling.
How Growth Rates Impact P/E Ratios
Generally speaking the rate of earnings growth has a profound impact on a company's P/E multiple. If earnings are growing quickly, then the 'E' in the equation will increase faster than it would otherwise. That means unless the share price increases, the P/E will reduce in a few years. So while a stock may look expensive based on past earnings, it could be cheap based on future earnings.
Cue Energy Resources's earnings per share fell by 40% in the last twelve months. And over the longer term (5 years) earnings per share have decreased 17% annually. This might lead to muted expectations.
Remember: P/E Ratios Don't Consider The Balance Sheet
Don't forget that the P/E ratio considers market capitalization. That means it doesn't take debt or cash into account. Hypothetically, a company could reduce its future P/E ratio by spending its cash (or taking on debt) to achieve higher earnings.
While growth expenditure doesn't always pay off, the point is that it is a good option to have; but one that the P/E ratio ignores.
So What Does Cue Energy Resources's Balance Sheet Tell Us?
Cue Energy Resources has net cash of AU$17m. This is fairly high at 34% of its market capitalization. That might mean balance sheet strength is important to the business, but should also help push the P/E a bit higher than it would otherwise be.
The Bottom Line On Cue Energy Resources's P/E Ratio
Cue Energy Resources has a P/E of 8.8. That's below the average in the AU market, which is 13.3. The recent drop in earnings per share would almost certainly temper expectations, the healthy balance sheet means the company retains potential for future growth. If that occurs, the current low P/E could prove to be temporary. What can be absolutely certain is that the market has become more pessimistic about Cue Energy Resources over the last month, with the P/E ratio falling from 16.9 back then to 8.8 today. For those who prefer invest in growth, this stock apparently offers limited promise, but the deep value investors may find the pessimism around this stock enticing.
Investors have an opportunity when market expectations about a stock are wrong. If the reality for a company is not as bad as the P/E ratio indicates, then the share price should increase as the market realizes this. We don't have analyst forecasts, but you might want to assess this data-rich visualization of earnings, revenue and cash flow.
Of course you might be able to find a better stock than Cue Energy Resources. So you may wish to see this free collection of other companies that have grown earnings strongly.
If you spot an error that warrants correction, please contact the editor at editorial-team@simplywallst.com. This article by Simply Wall St is general in nature. It does not constitute a recommendation to buy or sell any stock, and does not take account of your objectives, or your financial situation. Simply Wall St has no position in the stocks mentioned.
We aim to bring you long-term focused research analysis driven by fundamental data. Note that our analysis may not factor in the latest price-sensitive company announcements or qualitative material. Thank you for reading.
